IMAGE

Figure 3

ID
ZDB-IMAGE-250215-66
Source
Figures for Gu et al., 2025
Image
Figure Caption

Figure 3

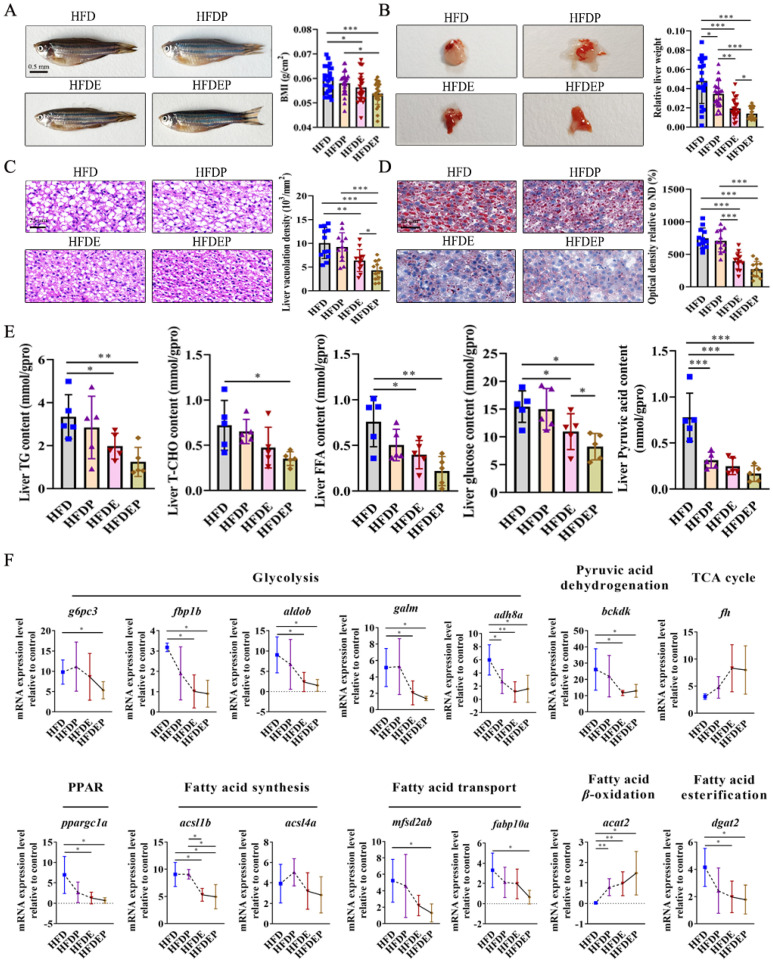
Effects of different intervention strategies on NAFLD: (A) Photographed fish and corresponding BMI. (B) Photographed liver and corresponding relative liver weight. (C,D) Histopathological sections of liver by HE and ORO staining, as well as their corresponding liver vacuolation density and optical density. Scale bar: 25 µm. (E) Determination on lipid indicators. (F) Expression levels of genes related to glucose (glycolysis, pyruvic acid dehydrogenation, and TCA cycle) and fatty acid metabolism (PPAR pathway transduction, fatty acid synthesis, fatty acid transport, fatty acid esterification, and fatty acid β-oxidation). Values are the mean ± SD. * p < 0.05, ** p < 0.01, *** p < 0.001 vs. control.

Acknowledgments
This image is the copyrighted work of the attributed author or publisher, and ZFIN has permission only to display this image to its users. Additional permissions should be obtained from the applicable author or publisher of the image. Full text @ Int. J. Mol. Sci.