FIGURE SUMMARY
Title

Dynamic interplay of cNHEJ and MMEJ pathways of DNA double-strand break repair during embryonic development in zebrafish

Authors
Carrara, M., Gaillard, A.L., Brion, A., Duvernois-Berthet, E., Giovannangeli, C., Concordet, J.P., Pézeron, G.
Source
Full text @ Sci. Rep.

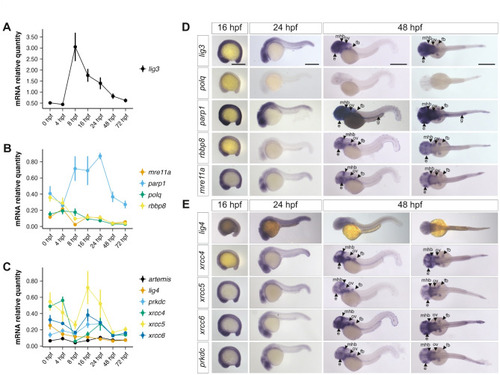
Analysis of MMEJ- and cNHEJ-related transcripts levels and distribution throughout embryonic development. (A-C) RT-qPCR analysis in embryos from 0 hpf to 72 hpf of relative mRNA levels for genes related to the MMEJ pathway and resection (A-B) and for genes related to the cNHEJ pathway (C). Note that, due to high expression levels, lig3 is presented separately (A). Expression levels are expressed as ratios to housekeeping genes (see methods). Data are means from four independent experiments. Error-bars are s.e.m. (D-E) Whole mount in situ hybridization for the same genes as in (A-C) genes related to the MMEJ pathway and regulation of resection (D) or related to the cNHEJ pathway (E) in wildtype embryos. Note that we could not produce a probe for artemis. Lateral view presented for 16 hpf, 24 hpf and left column of 48 hpf. Dorsal view presented in right column of 48 hpf. fb: fin buds; g: gut; e: eye; ov: otic vesicle; mhb: midbrain-hindbrain boundary. Scale bars: 500 microns.

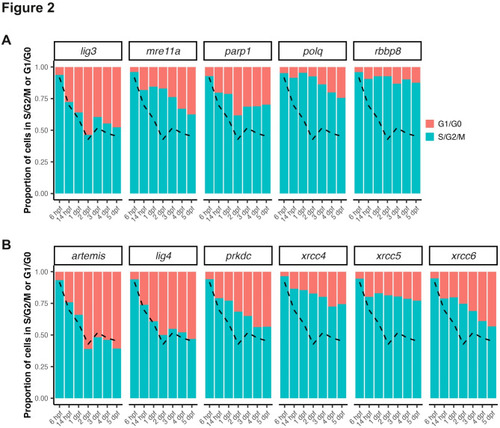
Analysis of mitotic activity in cells expressing MMEJ- and cNHEJ- related genes during embryogenesis. (A-B) Proportion of cells in S, G2 or M phase in cells expression genes related to MMEJ and resection (A) or related to cNHEJ (B) according to stage during embryonic development. In all panels, the dashed line indicates the average value for all cells at the corresponding stage. Data were computed from single-cell transcriptomic data from zebrafish embryo between 3 hpf and 5 dpf published by Sur et al.34 (see methods).

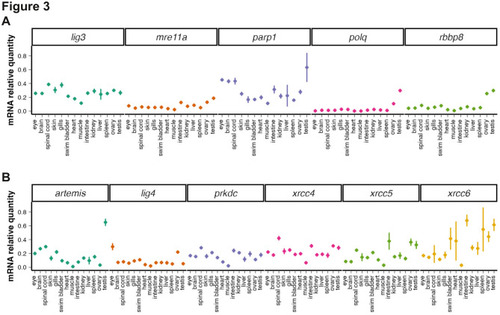
Analysis of mRNA levels of MMEJ- and cNHEJ- related genes across adult tissues. (A-B) RT-qPCR analysis for genes related to the MMEJ pathway and resection (A) and for genes related to the cNHEJ pathway (B) in adult fish tissue. Expression levels are expressed as ratios to housekeeping genes. Data are means from four independent experiments. Error-bars are s.e.m.

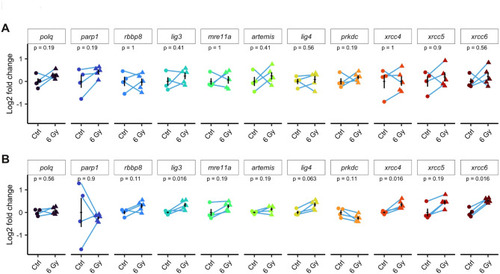
Analysis of mRNA levels of MMEJ- and cNHEJ-related genes in response to ionizing radiation exposure in embryos. (A-B) Embryos were exposed to a 6 Gy dose of ionizing radiation either at 4 hpf (A) or at 24 hpf (B). They were then left to develop for 2 h before mRNA extraction. Samples were pools of 40 (4 hpf) or 20 (24 hpf) embryos. Blue lines indicate samples from the same clutch of eggs (N = 4 for control and N = 5 for irradiated). Data are presented as Log2 of fold change compared to controls. Error-bars are s.e.m. p values from Wilcoxon tests.

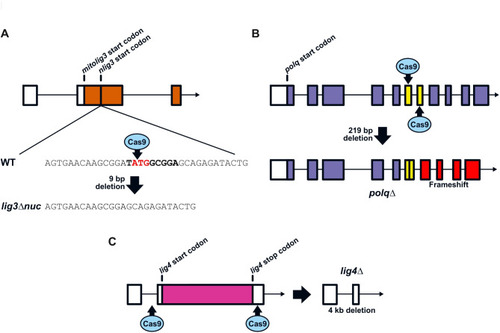
Inactivation of MMEJ and cNHEJ DNA repair pathways through CRISPR/Cas9-mediated gene knockout. (A-C) Schematics depicting the different gene knockout strategies used to inactivate the MMEJ and cNHEJ pathways. (A) Inactivation of the nuclear isoform of DNA ligase 3 (nLig3) was performed by inducing a small in-frame deletion of the nuclear isoform’s start codon. (B) The polq gene coding for DNA polymerase theta (Polθ) was knocked out by inducing a large deletion causing a frameshift early in the open reading frame. (C) The lig4 gene coding for DNA ligase 4 was knocked out by inducing a large deletion of the coding sequence by targeting non-coding DNA on either side.

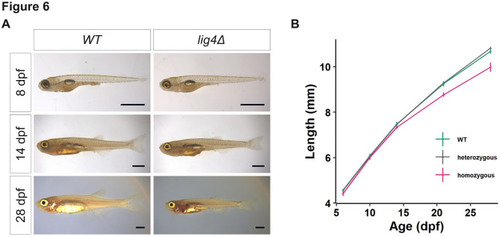
DNA ligase 4 is required for larval growth. (A) Comparison of wildtype (WT) and lig4 mutant sibling larvae development from 8 dpf to 28 dpf, same fish in the three pictures on each column, scale bar = 1 mm. (B) Growth monitoring of sibling larvae from a lig4 heterozygous cross (n = 8 homozygous mutants, n = 13 heterozygous, n = 9 wildtype), from 8 dpf to 28 dpf, error-bars are s.e.m.

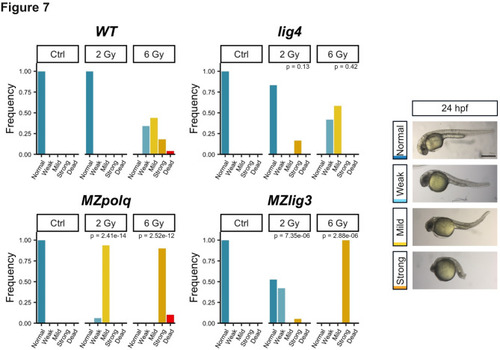
Inactivation of MMEJ sensitizes zebrafish embryos to IR. Embryos at 4 hpf were exposed to ionizing radiation (0, 2 and 6 Gy) and allowed to develop until 24 hpf. Phenotype was scored at 24 hpf according to the right panel scale. Weak = minor deformation of the tail, Mild = major deformation of the tail, Strong = atrophied tail and head, dead embryos were not imaged. WT, n = 140; MZlig3, n = 59; MZpolq, n = 71; and lig4, n = 22. P-values from Fisher’s Exact Test are indicated. Results for each mutant genotype at each dose were compared to those of wild-type samples at the corresponding dose. Image scale bar: 500 microns.

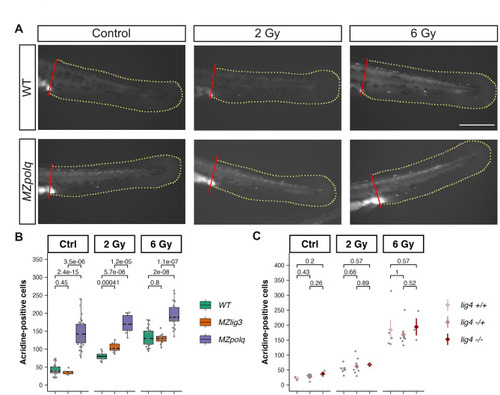
Cell death following irradiation in MMEJ and cNHEJ mutants. 24-hpf embryo from wildtype, MZpolq and MZlig3 and from lig4 heterozygous crosses were exposed to ionizing radiation (0, 2 and 6 Gy) and allowed to develop until 48 hpf. Cell death was then assayed using acridine orange staining (see methods) and quantified in the tail region. (A) Representative images of non-irradiated controls and irradiated with 2 and 6 Gy for wildtype and MZpolq mutant. Note the high number of fluorescent cells in MZpolq in both the control and the irradiated conditions. The red and the yellow lines delimit the area used for quantification. Scale bar: 200 microns. (B-C) Quantification of positive cells in WT, MZpolq, MZlig3 mutants (B) and in lig4 mutant (C). Cell numbers were normalized over the counted area. Note that lig4 mutants were obtained from heterozygous crosses and that embryos were genotyped after staining and scoring. Results from homozygous mutants, heterozygous, and wildtype siblings are presented. p.values from Wilcoxon tests.

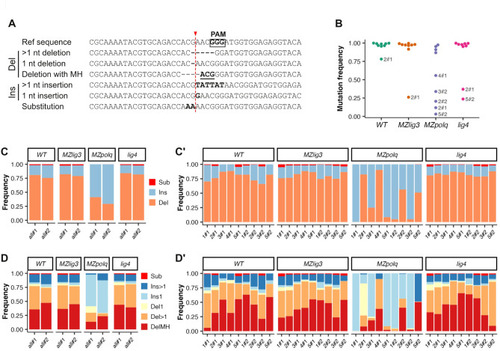
NGS analysis of the mutation spectrum after CRISPR/Cas9-mediated mutagenesis. CRISPR/Cas9-mediated mutagenesis was performed at 10 loci by injecting independently two mixes (#1 and #2) of five Cas9-GFP RNPs into zygotes (1–2 cell stage). For each mix, DNA was extracted at 9 hpf from pools of 20 embryos and PCR amplicons from all loci were sequenced, excepted one that could not be amplified. (A) Alignment representing examples of the different types of mutations that were quantified. In the reference sequence, the box indicates the PAM and the red dashed line the Cas9 cut site. Underlined nucleotides indicate MH. (B) Mutation frequency (number of mutant reads/total number of reads) for individual loci (points). (C-C’) Distribution of mutation types obtained globally for the two mixes (#1 and #2) (C) and at individual locus (C’) (Sub = substitutions; Ins = insertions; Del = Deletions). (D-D’) Distribution of mutation subtypes obtained globally (D) and at individual locus. (D’) (Sub = substitutions; Ins > 1 = insertions of 2 or more base pairs; Ins1 = insertion of 1 bp; Del > 1 = Deletions of 2 or more base pairs; Del1 = deletions of 1 bp; DelMH = deletions with MH).

Acknowledgments
This image is the copyrighted work of the attributed author or publisher, and ZFIN has permission only to display this image to its users. Additional permissions should be obtained from the applicable author or publisher of the image. Full text @ Sci. Rep.