IMAGE

Fig. 2

ID
ZDB-IMAGE-250212-36
Source
Figures for Carrara et al., 2025
Image
Figure Caption

Fig. 2

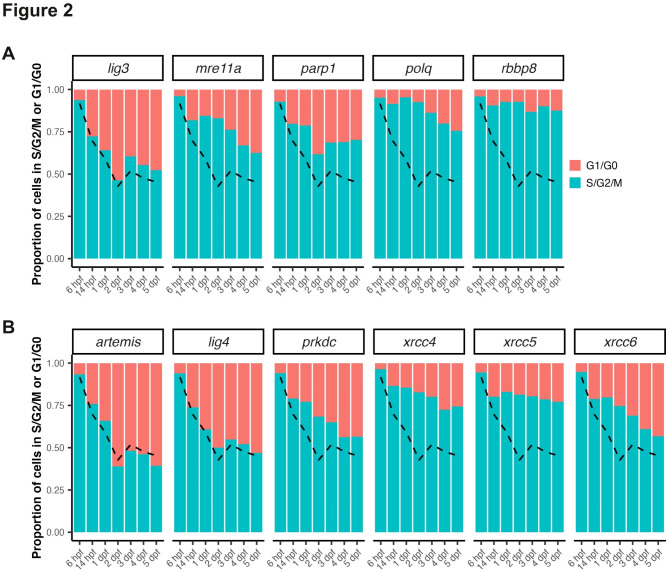
Analysis of mitotic activity in cells expressing MMEJ- and cNHEJ- related genes during embryogenesis. (A-B) Proportion of cells in S, G2 or M phase in cells expression genes related to MMEJ and resection (A) or related to cNHEJ (B) according to stage during embryonic development. In all panels, the dashed line indicates the average value for all cells at the corresponding stage. Data were computed from single-cell transcriptomic data from zebrafish embryo between 3 hpf and 5 dpf published by Sur et al.34 (see methods).

Acknowledgments
This image is the copyrighted work of the attributed author or publisher, and ZFIN has permission only to display this image to its users. Additional permissions should be obtained from the applicable author or publisher of the image. Full text @ Sci. Rep.