IMAGE

Fig. 9

ID
ZDB-IMAGE-250212-43
Source
Figures for Carrara et al., 2025
Image
Figure Caption

Fig. 9

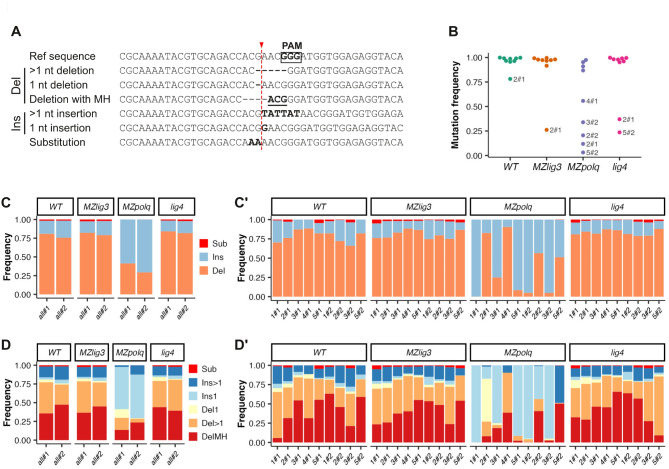
NGS analysis of the mutation spectrum after CRISPR/Cas9-mediated mutagenesis. CRISPR/Cas9-mediated mutagenesis was performed at 10 loci by injecting independently two mixes (#1 and #2) of five Cas9-GFP RNPs into zygotes (1–2 cell stage). For each mix, DNA was extracted at 9 hpf from pools of 20 embryos and PCR amplicons from all loci were sequenced, excepted one that could not be amplified. (A) Alignment representing examples of the different types of mutations that were quantified. In the reference sequence, the box indicates the PAM and the red dashed line the Cas9 cut site. Underlined nucleotides indicate MH. (B) Mutation frequency (number of mutant reads/total number of reads) for individual loci (points). (C-C’) Distribution of mutation types obtained globally for the two mixes (#1 and #2) (C) and at individual locus (C’) (Sub = substitutions; Ins = insertions; Del = Deletions). (D-D’) Distribution of mutation subtypes obtained globally (D) and at individual locus. (D’) (Sub = substitutions; Ins > 1 = insertions of 2 or more base pairs; Ins1 = insertion of 1 bp; Del > 1 = Deletions of 2 or more base pairs; Del1 = deletions of 1 bp; DelMH = deletions with MH).

Acknowledgments
This image is the copyrighted work of the attributed author or publisher, and ZFIN has permission only to display this image to its users. Additional permissions should be obtained from the applicable author or publisher of the image. Full text @ Sci. Rep.