
- Title
-
Endothelial calcium firing mediates the extravasation of metastatic tumor cells
- Authors
- Peralta, M., Dupas, A., Larnicol, A., Lefebvre, O., Goswami, R., Stemmelen, T., Molitor, A., Carapito, R., Girardo, S., Osmani, N., Goetz, J.G.
- Source
- Full text @ iScience
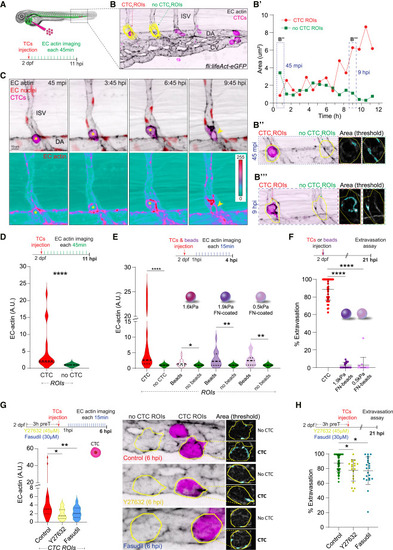
TCs stimulate endothelial actomyosin-dependent remodeling to extravasate (A) Schematic representation of the experimental design. (B) Example of EC-actin quantification: Yellow CTC- and no-CTC- ROIs are projected over the first time point of the time-lapse. Graph (B′) shows the EC-actin area through time. Example of the analysis pipeline selections for CTC- and no-CTC- ROIs (yellow line) at 45 mpi (B″) and 9 hpi (B’’’). (C) Time-lapse z stack projections show a CTC extravasating from an ISV. Bellow, an individual actin channel is displayed using ice LUT to facilitate the visualization of signal intensity, where green is the minimum and red is the maximum. For all the images, yellow asterisks label intravascular CTC, yellow arrowhead marks the extravasated CTC. (D) Schematic representation of the experimental design. Graph shows the EC actin clustering for each pair of ROIs (CTC and no-CTC) throughout the time lapse in arbitrary units (A.U., Wilcoxon matched-pairs signed rank test, p-value <0.0001, 3 embryos, 17 CTC- and no-CTC- ROIs measured for 11 hpi time-lapse). (E) Schematic representation of the experimental design. Graph shows the EC actin clustering for each pair of ROIs (CTC and no-CTC or beads and no-beads, respectively) throughout the time lapse in arbitrary units (A.U., Wilcoxon matched-pairs signed rank test, CTCs: p-value <0.0001; 1.6kPa beads: p-value 0.019; 1.9kPa fibronectin-coated beads: p-value 0.0028; 0.5kPa fibronectin-coated beads: p-value 0.0034, CTCs: 3 embryos, 17 CTC- and no-CTC- ROIs measured; 1.6kPa beads: 8 embryos, 23 bead- and no-bead- ROIs measured; 1.9kPa fibronectin-coated beads: 5 embryos, 18 bead- and no-bead- ROIs measured; 0.5kPa fibronectin-coated beads: 8 embryos, 15 bead- and no-bead- ROIs measured for 4 hpi time-lapse). (F) Schematic representation of the experimental design. Graph shows CTCs, 1.9kPa- and 0.5kPa-fibronectin-coated beads percentage of extravasation at 21 hpi (Kruskal-Wallis test multiple comparison p values <0.0001; CTCs: 42 embryos; 1.9kPa: 14 embryos; 0.5kPa: 14 embryos). Data are represented as mean ± SD. (G) Schematic representation of the experimental design. Graph shows the EC actin clustering for control, Y27632- or Fasudil-treated embryos throughout the time lapse in arbitrary units (A.U., Kruskal-Wallis test multiple comparison control vs. Y27632 p value 0.048; control vs. Fasudil p value 0.0028; control: 6 embryos, 28 CTC-ROIs measured; Y27632: 4 embryos, 13 CTC-ROIs measured; Fasudil: 8 embryos, 13 CTC-ROIs measured for 6 hpi time-lapse). Images show representative examples of the analysis pipeline selections for CTC- and no-CTC- ROIs (yellow line) at 6 hpi for each condition. (H) Schematic representation of the experimental design. Graph shows control, Y27632- or Fasudil-treated embryos percentage of extravasation (Kruskal-Wallis test multiple comparison control vs. Y27632 p value 0.024; control vs. Fasudil p value 0.031; control: 48 embryos; Y27632: 19 embryos; Fasudil: 22 embryos). Data are represented as mean ± SD. |
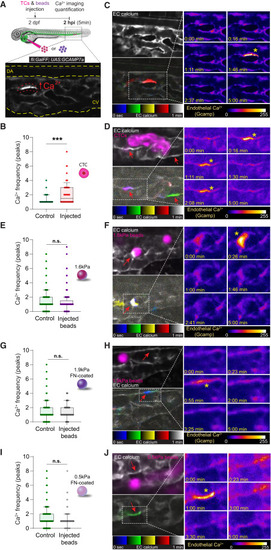
Arrest of CTCs triggers endothelial calcium firing (A) Schematic representation of the experimental design. Image illustrates calcium firing in an EC. (B) Graph shows EC calcium firing frequency (number of peaks) in non-injected (control) and injected embryos at 2 hpi (Mann Whitney test, p-value 0.0002; controls: 5 embryos, 52 cells quantified; injected: 5 embryos, 82 cells quantified). Graph is a boxplot (upper/lower quartile, median, bars show the 10%–90% range), each dot represents an individual EC. (C) Confocal section showing EC calcium signaling (white). Bellow, EC calcium imaging displayed using temporal color code for 1 min in a control embryo showing one EC calcium firing (red). Right panel: zooms of representative timepoints extracted from 5 min continuous confocal imaging. Signal is displayed using fire LUT to facilitate the visualization of signal intensity, where blue is the minimum and white is the maximum. Asterisk highlights an EC calcium firing. (D) Confocal section showing EC calcium signaling (white) and CTCs (magenta). Bellow, EC calcium imaging is displayed using temporal color code for 1 min in a CTCs-injected embryo showing two ECs calcium firings (one EC showing one calcium firing in green; another EC in purple because calcium fired twice, one in the blue and one in the red display). Right panel: zooms of representative timepoints extracted from 5 min continuous imaging. Signal displayed using fire LUT to facilitate the visualization of signal intensity, where blue is the minimum and white is the maximum. Asterisks highlight EC calcium firings. (E) Graph shows 1.6kPa beads injections (Mann Whitney test, p value 0.38; controls: 7 embryos, 184 cells quantified; injected: 8 embryos, 153 cells quantified). Graph is a boxplot (upper/lower quartile, median, bars show the 10%–90% range), each dot represents an individual EC. (F) Confocal section showing EC calcium signaling (white) and 1.6kPa beads (magenta). Bellow, EC calcium imaging is displayed using temporal color code for 1 min in an injected embryo showing one EC calcium firing (white). Right panel: zooms of representative timepoints extracted from 5 min continuous imaging. Signal is displayed using fire LUT to facilitate the visualization of signal intensity, where blue is the minimum and white is the maximum. Asterisk highlights an EC calcium firing. (G) Graph shows 1.9kPa-fibronectin-coated beads injections (Mann Whitney test, p-value 0.19; controls: 8 embryos, 177 cells quantified; injected: 7 embryos, 182 cells quantified). Graph is a boxplot (upper/lower quartile, median, bars show the 10%–90% range), each dot represents an individual EC. (H) Confocal section showing EC calcium signaling (white) and 1.9kPa – FN-coated beads (magenta). Bellow, EC calcium imaging is displayed using temporal color code for 1 min in an injected embryo showing one EC calcium firing (blue). Right panel: zooms of representative timepoints extracted from 5 min continuous imaging. Signal is displayed using fire LUT to facilitate the visualization of signal intensity, where blue is the minimum and white is the maximum. Asterisk highlights an EC calcium firing. (I) Graph shows 0.5kPa-fibronectin-coated beads injections (Mann Whitney test, p value 0.08; controls: 4 embryos, 99 cells quantified; injected: 5 embryos, 113 cells quantified). Graph is a boxplot (upper/lower quartile, median, bars show the 10%–90% range), each dot represents an individual EC. (J) Confocal section showing EC calcium signaling (white) and 0.5kPa – FN-coated beads (magenta). Bellow, EC calcium imaging is displayed using temporal color code for 1 min in an injected embryo showing one EC calcium firing (green). Right panel: zooms of representative timepoints extracted from 5 min continuous imaging. Signal is displayed using fire LUT to facilitate the visualization of signal intensity, where blue is the minimum and white is the maximum. Asterisk highlights an EC calcium firing. In all images, red arrows point at selected ECs. All graphs are boxplots (upper/lower quartile, median, bars show the 10%–90% range), and each dot represents an individual EC. |
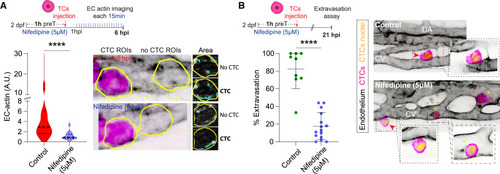
Impairing Ca2+ signaling prevents metastatic extravasation (A) Schematic representation of the experimental design. Graph shows EC actin clustering for control (CTC ROIs from non-treated embryos) and nifedipine-treated embryos throughout the time lapse in arbitrary units (A.U., Mann Whitney test, p-value 0.0001; control: 3 embryos, 19 CTC- ROIs measured; nifedipine: 2 embryos, 18 CTC- ROIs measured for 6 hpi time-lapse). Images show representative examples of the analysis pipeline selections for CTC- and no-CTC- ROIs (yellow line) at 6 hpi for each condition. (B) Schematic representation of the experimental design. Graph shows the percentage of CTC extravasation in control and nifedipine-treated embryos at 21 hpi (Mann Whitney test, p-value 0.0001; control: 9 embryos; nifedipine-treated: 15 embryos). Data are represented as mean ± SD. Confocal z stack projections displaying representative examples of control and nifedipine-treated embryos. EC channel is displayed using inverted LUT to facilitate visualization. Zoom boxes show a single confocal plane to improve the visualization of intravascular (yellow asterisks) and extravascular (red arrowhead) CTCs. |
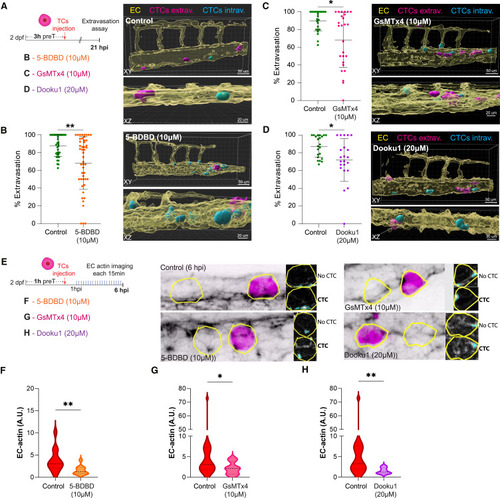
Impairing metastatic extravasation by targeting endothelial mechano-gated calcium channels (A) Schematic representation of the experimental design for B, C, and D. (B) Left panel: graph shows the percentage of CTC extravasation in control and 5-BDBD-treated embryos at 21 hpi (Mann Whitney test, p-value 0.0018; controls: 37 embryos; 5-BDBD: 48 embryos). Data are represented as mean ± SD. Right panel: 3D projections displaying representative examples of control (top) and 5-BDBD-treated embryos (bottom). Transparent EC channel (yellow) facilitates the visualization of intravascular (cyan) and extravascular (magenta) CTCs. (C) Left panel: graph shows the percentage of CTC extravasation in control and GsMTx4-treated embryos at 21 hpi (Mann Whitney test, p-value 0.0018; controls: 24 embryos; GsMTx4: 26 embryos). Data are represented as mean ± SD. Right panel: 3D projections displaying representative examples of GsMTx4-treated embryos. Transparent EC channel (yellow) facilitates the visualization of intravascular (cyan) and extravascular (magenta) CTCs. (D) Left panel: graph shows the percentage of CTC extravasation in control and Dooku1-treated embryos at 21 hpi (Mann Whitney test, p-value 0.018; controls: 22 embryos; Dooku1: 22 embryos). Data are represented as mean ± SD. Right panel: 3D projections displaying representative examples of Dooku1-treated embryos. Transparent EC channel (yellow) facilitates the visualization of intravascular (cyan) and extravascular (magenta) CTCs. (E) Schematic representation of the experimental design for F, G, and H. (F) Graph shows EC actin clustering for control (CTC ROIs from non-treated embryos) and 5-BDBD-treated embryos throughout the time lapse in arbitrary units (A.U.) (Mann Whitney test, p value 0.007; control: 6 embryos, 13 CTC-ROIs measured; 5-BDBD: 5 embryos; 11 CTC-ROIs measured for 6 hpi time lapse). (G) Graph shows EC actin clustering for control (CTC ROIs from non-treated embryos) and GSMTx4-treated embryos throughout the time lapse in arbitrary units (A.U.) (Mann Whitney test, p value 0.0364; control: 11 embryos, 18 CTC-ROIs measured; GSMTx4: 9 embryos; 15 CTC-ROIs measured for 6 hpi time lapse). (H) Graph shows EC actin clustering for control (CTC ROIs from non-treated embryos) and Dooku1-treated embryos throughout the time lapse in arbitrary units (A.U.) (Mann Whitney test, p value 0.0034; control: 7 embryos, 13 CTC-ROIs measured; GSMTx4: 5 embryos; 7 CTC-ROIs measured for 6 hpi time lapse). |
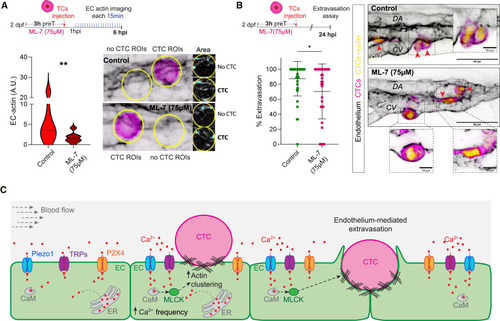
Impairing Ca2+/Calmodulin/MLCK/myosin signaling prevents metastatic extravasation (A) Schematic representation of the experimental design. Graph shows EC actin clustering for control (CTC ROIs from non-treated embryos) and ML-7-treated embryos throughout the time lapse in arbitrary units (A.U.) (Mann Whitney test, p value 0.002; control: 5 embryos, 10 CTC-ROIs measured; ML-7: 8 embryos; 14 CTC-ROIs measured for 6 hpi time lapse). Images show representative examples of the analysis pipeline selections for CTC- and no-CTC- ROIs (yellow line) at 6 hpi for each condition. (B) Schematic representation of the experimental design. Graph shows the percentage of CTC extravasation in control and ML-7-treated embryos at 21 hpi (Mann Whitney test, p-value 0.0349; control: 40 embryos; ML-7-treated: 34 embryos). Data are represented as mean ± SD. Confocal z stack projections displaying representative examples of control and nifedipine-treated embryos. EC channel is displayed using inverted LUT to facilitate visualization. Zoom boxes show a single confocal plane to improve the visualization of intravascular (yellow asterisks) and extravascular (red arrowhead) CTCs. (C) Schematic representation of the mechanochemical Ca2+ signaling driving extravasation. |