
Fig. 4
- ID
- ZDB-FIG-250311-51
- Publication
- Peralta et al., 2024 - Endothelial calcium firing mediates the extravasation of metastatic tumor cells
- Other Figures
- All Figure Page
- Back to All Figure Page
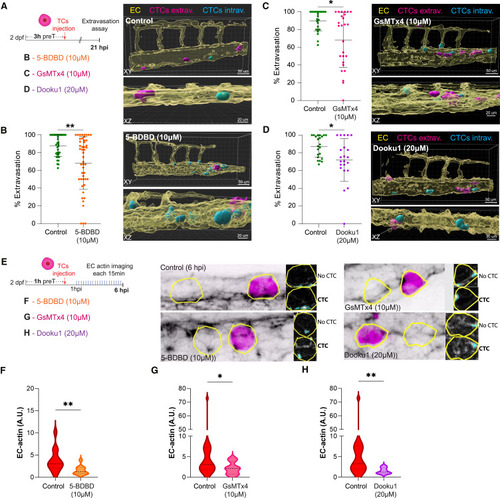
Impairing metastatic extravasation by targeting endothelial mechano-gated calcium channels (A) Schematic representation of the experimental design for B, C, and D. (B) Left panel: graph shows the percentage of CTC extravasation in control and 5-BDBD-treated embryos at 21 hpi (Mann Whitney test, p-value 0.0018; controls: 37 embryos; 5-BDBD: 48 embryos). Data are represented as mean ± SD. Right panel: 3D projections displaying representative examples of control (top) and 5-BDBD-treated embryos (bottom). Transparent EC channel (yellow) facilitates the visualization of intravascular (cyan) and extravascular (magenta) CTCs. (C) Left panel: graph shows the percentage of CTC extravasation in control and GsMTx4-treated embryos at 21 hpi (Mann Whitney test, p-value 0.0018; controls: 24 embryos; GsMTx4: 26 embryos). Data are represented as mean ± SD. Right panel: 3D projections displaying representative examples of GsMTx4-treated embryos. Transparent EC channel (yellow) facilitates the visualization of intravascular (cyan) and extravascular (magenta) CTCs. (D) Left panel: graph shows the percentage of CTC extravasation in control and Dooku1-treated embryos at 21 hpi (Mann Whitney test, p-value 0.018; controls: 22 embryos; Dooku1: 22 embryos). Data are represented as mean ± SD. Right panel: 3D projections displaying representative examples of Dooku1-treated embryos. Transparent EC channel (yellow) facilitates the visualization of intravascular (cyan) and extravascular (magenta) CTCs. (E) Schematic representation of the experimental design for F, G, and H. (F) Graph shows EC actin clustering for control (CTC ROIs from non-treated embryos) and 5-BDBD-treated embryos throughout the time lapse in arbitrary units (A.U.) (Mann Whitney test, p value 0.007; control: 6 embryos, 13 CTC-ROIs measured; 5-BDBD: 5 embryos; 11 CTC-ROIs measured for 6 hpi time lapse). (G) Graph shows EC actin clustering for control (CTC ROIs from non-treated embryos) and GSMTx4-treated embryos throughout the time lapse in arbitrary units (A.U.) (Mann Whitney test, p value 0.0364; control: 11 embryos, 18 CTC-ROIs measured; GSMTx4: 9 embryos; 15 CTC-ROIs measured for 6 hpi time lapse). (H) Graph shows EC actin clustering for control (CTC ROIs from non-treated embryos) and Dooku1-treated embryos throughout the time lapse in arbitrary units (A.U.) (Mann Whitney test, p value 0.0034; control: 7 embryos, 13 CTC-ROIs measured; GSMTx4: 5 embryos; 7 CTC-ROIs measured for 6 hpi time lapse). |