
|
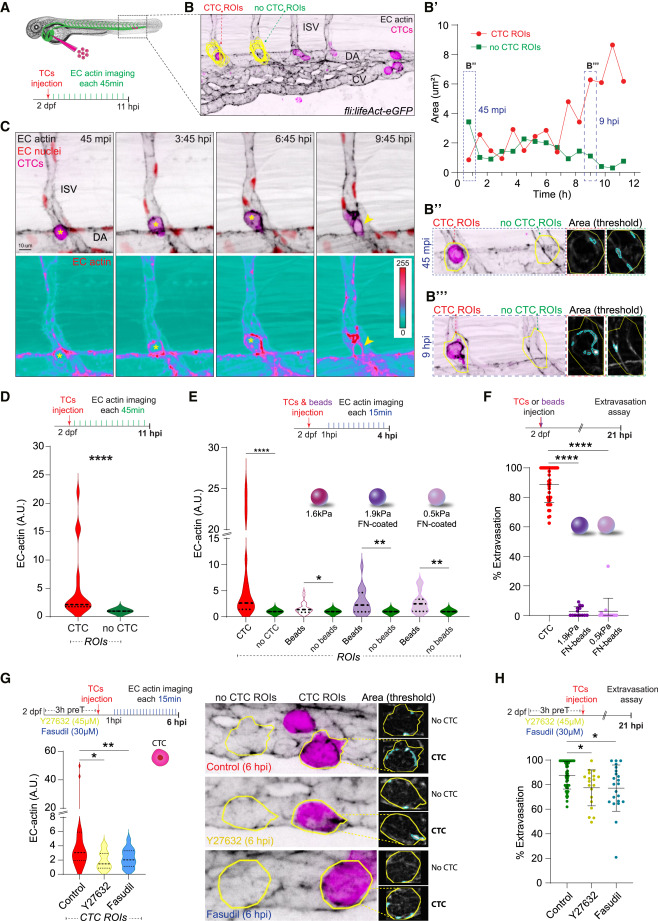
Fig. 1 TCs stimulate endothelial actomyosin-dependent remodeling to extravasate (A) Schematic representation of the experimental design. (B) Example of EC-actin quantification: Yellow CTC- and no-CTC- ROIs are projected over the first time point of the time-lapse. Graph (B′) shows the EC-actin area through time. Example of the analysis pipeline selections for CTC- and no-CTC- ROIs (yellow line) at 45 mpi (B″) and 9 hpi (B’’’). (C) Time-lapse z stack projections show a CTC extravasating from an ISV. Bellow, an individual actin channel is displayed using ice LUT to facilitate the visualization of signal intensity, where green is the minimum and red is the maximum. For all the images, yellow asterisks label intravascular CTC, yellow arrowhead marks the extravasated CTC. (D) Schematic representation of the experimental design. Graph shows the EC actin clustering for each pair of ROIs (CTC and no-CTC) throughout the time lapse in arbitrary units (A.U., Wilcoxon matched-pairs signed rank test, p-value <0.0001, 3 embryos, 17 CTC- and no-CTC- ROIs measured for 11 hpi time-lapse). (E) Schematic representation of the experimental design. Graph shows the EC actin clustering for each pair of ROIs (CTC and no-CTC or beads and no-beads, respectively) throughout the time lapse in arbitrary units (A.U., Wilcoxon matched-pairs signed rank test, CTCs: p-value <0.0001; 1.6kPa beads: p-value 0.019; 1.9kPa fibronectin-coated beads: p-value 0.0028; 0.5kPa fibronectin-coated beads: p-value 0.0034, CTCs: 3 embryos, 17 CTC- and no-CTC- ROIs measured; 1.6kPa beads: 8 embryos, 23 bead- and no-bead- ROIs measured; 1.9kPa fibronectin-coated beads: 5 embryos, 18 bead- and no-bead- ROIs measured; 0.5kPa fibronectin-coated beads: 8 embryos, 15 bead- and no-bead- ROIs measured for 4 hpi time-lapse). (F) Schematic representation of the experimental design. Graph shows CTCs, 1.9kPa- and 0.5kPa-fibronectin-coated beads percentage of extravasation at 21 hpi (Kruskal-Wallis test multiple comparison p values <0.0001; CTCs: 42 embryos; 1.9kPa: 14 embryos; 0.5kPa: 14 embryos). Data are represented as mean ± SD. (G) Schematic representation of the experimental design. Graph shows the EC actin clustering for control, Y27632- or Fasudil-treated embryos throughout the time lapse in arbitrary units (A.U., Kruskal-Wallis test multiple comparison control vs. Y27632 p value 0.048; control vs. Fasudil p value 0.0028; control: 6 embryos, 28 CTC-ROIs measured; Y27632: 4 embryos, 13 CTC-ROIs measured; Fasudil: 8 embryos, 13 CTC-ROIs measured for 6 hpi time-lapse). Images show representative examples of the analysis pipeline selections for CTC- and no-CTC- ROIs (yellow line) at 6 hpi for each condition. (H) Schematic representation of the experimental design. Graph shows control, Y27632- or Fasudil-treated embryos percentage of extravasation (Kruskal-Wallis test multiple comparison control vs. Y27632 p value 0.024; control vs. Fasudil p value 0.031; control: 48 embryos; Y27632: 19 embryos; Fasudil: 22 embryos). Data are represented as mean ± SD.