
|
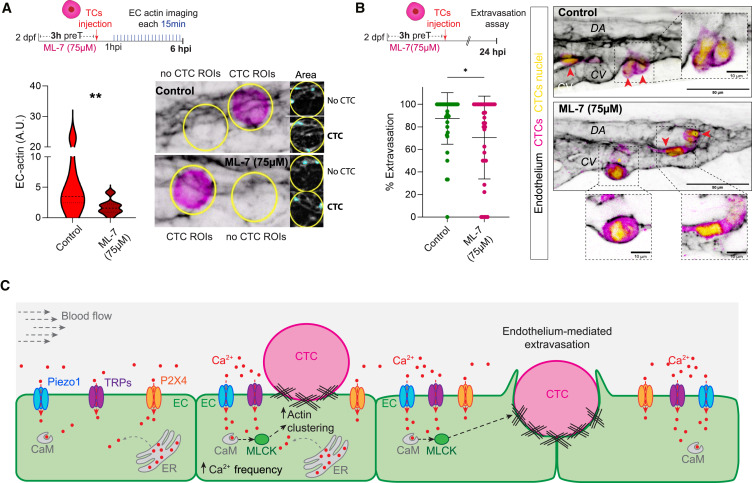
Fig. 5 Impairing Ca2+/Calmodulin/MLCK/myosin signaling prevents metastatic extravasation (A) Schematic representation of the experimental design. Graph shows EC actin clustering for control (CTC ROIs from non-treated embryos) and ML-7-treated embryos throughout the time lapse in arbitrary units (A.U.) (Mann Whitney test, p value 0.002; control: 5 embryos, 10 CTC-ROIs measured; ML-7: 8 embryos; 14 CTC-ROIs measured for 6 hpi time lapse). Images show representative examples of the analysis pipeline selections for CTC- and no-CTC- ROIs (yellow line) at 6 hpi for each condition. (B) Schematic representation of the experimental design. Graph shows the percentage of CTC extravasation in control and ML-7-treated embryos at 21 hpi (Mann Whitney test, p-value 0.0349; control: 40 embryos; ML-7-treated: 34 embryos). Data are represented as mean ± SD. Confocal z stack projections displaying representative examples of control and nifedipine-treated embryos. EC channel is displayed using inverted LUT to facilitate visualization. Zoom boxes show a single confocal plane to improve the visualization of intravascular (yellow asterisks) and extravascular (red arrowhead) CTCs. (C) Schematic representation of the mechanochemical Ca2+ signaling driving extravasation.