
Fig. 2
- ID
- ZDB-FIG-250311-49
- Publication
- Peralta et al., 2024 - Endothelial calcium firing mediates the extravasation of metastatic tumor cells
- Other Figures
- All Figure Page
- Back to All Figure Page
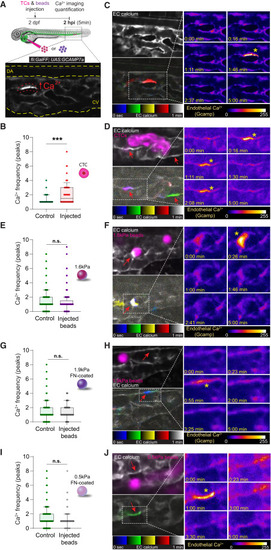
Arrest of CTCs triggers endothelial calcium firing (A) Schematic representation of the experimental design. Image illustrates calcium firing in an EC. (B) Graph shows EC calcium firing frequency (number of peaks) in non-injected (control) and injected embryos at 2 hpi (Mann Whitney test, p-value 0.0002; controls: 5 embryos, 52 cells quantified; injected: 5 embryos, 82 cells quantified). Graph is a boxplot (upper/lower quartile, median, bars show the 10%–90% range), each dot represents an individual EC. (C) Confocal section showing EC calcium signaling (white). Bellow, EC calcium imaging displayed using temporal color code for 1 min in a control embryo showing one EC calcium firing (red). Right panel: zooms of representative timepoints extracted from 5 min continuous confocal imaging. Signal is displayed using fire LUT to facilitate the visualization of signal intensity, where blue is the minimum and white is the maximum. Asterisk highlights an EC calcium firing. (D) Confocal section showing EC calcium signaling (white) and CTCs (magenta). Bellow, EC calcium imaging is displayed using temporal color code for 1 min in a CTCs-injected embryo showing two ECs calcium firings (one EC showing one calcium firing in green; another EC in purple because calcium fired twice, one in the blue and one in the red display). Right panel: zooms of representative timepoints extracted from 5 min continuous imaging. Signal displayed using fire LUT to facilitate the visualization of signal intensity, where blue is the minimum and white is the maximum. Asterisks highlight EC calcium firings. (E) Graph shows 1.6kPa beads injections (Mann Whitney test, p value 0.38; controls: 7 embryos, 184 cells quantified; injected: 8 embryos, 153 cells quantified). Graph is a boxplot (upper/lower quartile, median, bars show the 10%–90% range), each dot represents an individual EC. (F) Confocal section showing EC calcium signaling (white) and 1.6kPa beads (magenta). Bellow, EC calcium imaging is displayed using temporal color code for 1 min in an injected embryo showing one EC calcium firing (white). Right panel: zooms of representative timepoints extracted from 5 min continuous imaging. Signal is displayed using fire LUT to facilitate the visualization of signal intensity, where blue is the minimum and white is the maximum. Asterisk highlights an EC calcium firing. (G) Graph shows 1.9kPa-fibronectin-coated beads injections (Mann Whitney test, p-value 0.19; controls: 8 embryos, 177 cells quantified; injected: 7 embryos, 182 cells quantified). Graph is a boxplot (upper/lower quartile, median, bars show the 10%–90% range), each dot represents an individual EC. (H) Confocal section showing EC calcium signaling (white) and 1.9kPa – FN-coated beads (magenta). Bellow, EC calcium imaging is displayed using temporal color code for 1 min in an injected embryo showing one EC calcium firing (blue). Right panel: zooms of representative timepoints extracted from 5 min continuous imaging. Signal is displayed using fire LUT to facilitate the visualization of signal intensity, where blue is the minimum and white is the maximum. Asterisk highlights an EC calcium firing. (I) Graph shows 0.5kPa-fibronectin-coated beads injections (Mann Whitney test, p value 0.08; controls: 4 embryos, 99 cells quantified; injected: 5 embryos, 113 cells quantified). Graph is a boxplot (upper/lower quartile, median, bars show the 10%–90% range), each dot represents an individual EC. (J) Confocal section showing EC calcium signaling (white) and 0.5kPa – FN-coated beads (magenta). Bellow, EC calcium imaging is displayed using temporal color code for 1 min in an injected embryo showing one EC calcium firing (green). Right panel: zooms of representative timepoints extracted from 5 min continuous imaging. Signal is displayed using fire LUT to facilitate the visualization of signal intensity, where blue is the minimum and white is the maximum. Asterisk highlights an EC calcium firing. In all images, red arrows point at selected ECs. All graphs are boxplots (upper/lower quartile, median, bars show the 10%–90% range), and each dot represents an individual EC. |