
- Title
-
Dynamic changes of extracellular vesicles during zebrafish organogenesis
- Authors
- Mulzer, L.M., Felger, T., Muñoz, L.E., Engl, G., Reutter, H., Schiffer, M., Jahromi, L.P., Boros, F.A., Zunke, F., Arnold, P., Hilger, A.C.
- Source
- Full text @ Cell Commun. Signal.
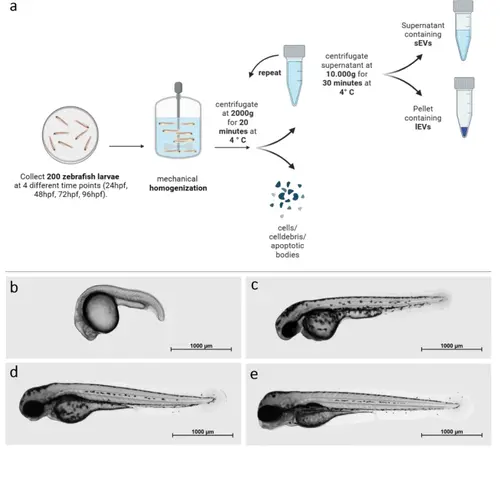
Protocol of EV isolation and zebrafish larvae development: a: Isolation protocol for whole zfl sEVs and lEVs by differential centrifugation. b-e: Zfl development; Imaging was performed at the 4 observation time points in 2% low-melting agarose (peqLab, Erlangen, Germany) using an Axio Observer microscope system (Zeiss, Jena, Germany), magnification 2,5x. b: 24 hpf, c: 48 hpf, d: 72 hpf, e: 96 hpf |
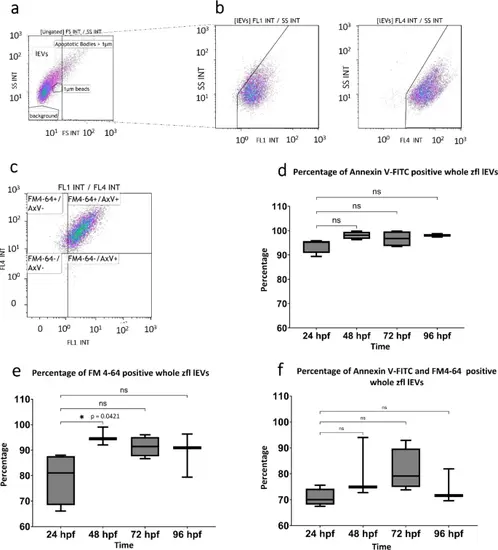
Characterization of whole zfl lEVs using flow cytometry: Gating strategy flow cytometry. a: First we determined the lEV gate by size using a forward scatter below the size of 1 micrometer polystyrene beads (Sigma-Aldrich, Steinheim, Germany) and excluding background signals as shown in the side scatter versus forward scatter plot. b: Further, a polygonal gate was used to exclude events with a higher side scatter, which might be aggregated lEVs. This can be seen in the scatter plots selected for the respective fluorescence: side scatter versus FL1 and side scatter versus FL4. AxV-FITC and/or FM4-64 were added to resuspended 10.000 g homogenized whole zfl pellets, incubated and measured directly and undiluted with flow cytometry. The expression of AxV-FITC and FM4-64 was analysed within these defined lEV gates. Gates defining the respective dye positive fraction were drawn in respect to an obviously negative fraction within the same measurement c: Double positive lEVs were gated in the same way and then analysed in 4 quadrants according to their positivity. FM4-64+/AxV-: lEVs negative for AxV-FITC but positive for FM4-64. FM4-64+/AxV+: lEVs showing positivity for both dyes FM4-64 and AxV-FITC. FM4-64-/AxV-: lEVs neither positive for AxV-FITC nor FM4-64. FM4-64-/AxV+: lEVs negative for FM4-64, but positive for AxV-FITC. d: Percentage of AxV + whole zfl lEVs at the 4 observation time points (24 hpf, 48 hpf, 72 hpf, 96 hpf), n = 4. e: Percentage of FM4-64 + whole zfl lEVs at the 4 observation time points (24 hpf, 48 hpf, 72 hpf, 96 hpf), n = 4. f: Percentage of FM4-64 + and AxV + whole zfl lEVs at the 4 observation time points (24 hpf, 48 hpf, 72 hpf, 96 hpf), n = 4. All results are presented as box plots with median, minimum, maximum, and interquartile ranges. * p < 0.05 |
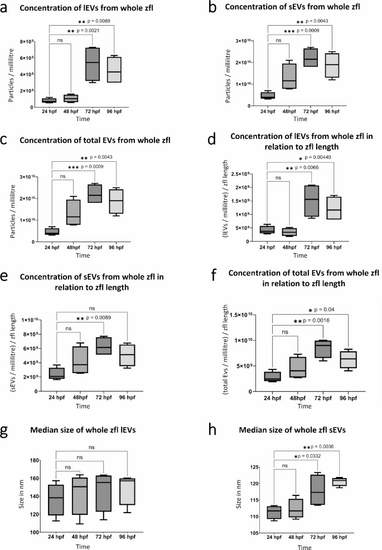
Determination of size and concentration of whole zfl EVs: a-f: Quantity of zfl sEVs, lEVs, and total EVs during the first 96 hpf. Concentration of EVs (particles/millilitre) was determined using NTA. a: Particles/millilitre of zfl lEV samples at the 4 observation time points (24 hpf, 48 hpf, 72 hpf, 96 hpf), n = 4. b: Particles/millilitre of zfl sEV samples at the 4 observation time points ( 24 hpf, 48 hpf, 72 hpf, 96 hpf), n = 4. c: Particles/millilitre of zfl lEV samples and sEV samples (= total EVs) at the 4 observation time points (24 hpf, 48 hpf, 72 hpf, 96 hpf), n = 4. d: particles/millilitre of zfl lEV samples at the 4 observation time points (24 hpf, 48 hpf, 72 hpf, 96 hpf), n = 4, divided through the length of the zfl at the respective time point. e: Particles/millilitre of zfl sEV samples at the 4 observation time points (24 hpf, 48 hpf, 72 hpf, 96 hpf), n = 4, divided through the length of the zfl at the respective time point. f: Particles/millilitre of zfl lEV and sEV samples (= total EVs) at the 4 observation time points (24 hpf, 48 hpf, 72 hpf, 96 hpf), n = 4, divided through the length of the zfl at the respective time point. All results are presented as box plots with median, minimum, maximum, and interquartile ranges. * p < 0.05. g-h: Median size of zfl sEVs and whole zfl lEVs during the first 96hpf. Size was determined using NTA. g: Median size of whole zfl lEVs at the 4 observation time points (24 hpf, 48 hpf, 72 hpf, 96 hpf), n = 4. h: Median size of whole zfl sEVs at the 4 observation time points (24 hpf, 48 hpf, 72 hpf, 96 hpf), n = 4. All results are presented as box plots with median, minimum, maximum, and interquartile ranges. * p < 0.05 |
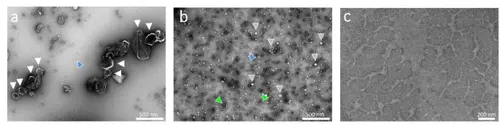
Morphology characterization of whole zfl sEVs and lEVs by TEM: The micrographs were collected on a JEOL 1400 Plus TEM (JEOL Germany, Munich, Germany) operating at 120 kV with a nominal magnification of 30.000x. a: 10.000 g homogenized whole zfl pellet at 30k magnification: cup shaped lEVs (white arrowhead), in the background some triangular shaped protein (blue arrowhead). The white bar in the lower right quadrant of the image corresponds to 500 nm. b: 10.000 g homogenized whole zfl supernatant at 30k magnification: sEVs of around ~ 70–100 nm (some depicted with grey arrowheads), the background is covered with triangular shaped protein (blue arrowhead) and some proteins aggregates appear (two marked with green arrowheads). The white bar in the lower right quadrant of the image corresponds to 500 nm. c: Zfl medium at 72 hpf at 30k magnification: no EVs, background with staining artefact. The white bar in the lower right quadrant of the image corresponds to 200 nm |