
Fig. 3
- ID
- ZDB-FIG-250311-55
- Publication
- Mulzer et al., 2025 - Dynamic changes of extracellular vesicles during zebrafish organogenesis
- Other Figures
- All Figure Page
- Back to All Figure Page
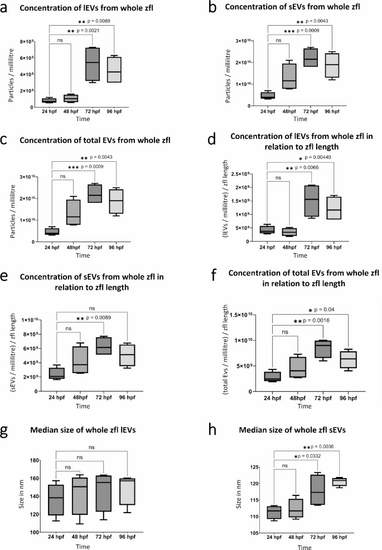
Determination of size and concentration of whole zfl EVs: a-f: Quantity of zfl sEVs, lEVs, and total EVs during the first 96 hpf. Concentration of EVs (particles/millilitre) was determined using NTA. a: Particles/millilitre of zfl lEV samples at the 4 observation time points (24 hpf, 48 hpf, 72 hpf, 96 hpf), n = 4. b: Particles/millilitre of zfl sEV samples at the 4 observation time points ( 24 hpf, 48 hpf, 72 hpf, 96 hpf), n = 4. c: Particles/millilitre of zfl lEV samples and sEV samples (= total EVs) at the 4 observation time points (24 hpf, 48 hpf, 72 hpf, 96 hpf), n = 4. d: particles/millilitre of zfl lEV samples at the 4 observation time points (24 hpf, 48 hpf, 72 hpf, 96 hpf), n = 4, divided through the length of the zfl at the respective time point. e: Particles/millilitre of zfl sEV samples at the 4 observation time points (24 hpf, 48 hpf, 72 hpf, 96 hpf), n = 4, divided through the length of the zfl at the respective time point. f: Particles/millilitre of zfl lEV and sEV samples (= total EVs) at the 4 observation time points (24 hpf, 48 hpf, 72 hpf, 96 hpf), n = 4, divided through the length of the zfl at the respective time point. All results are presented as box plots with median, minimum, maximum, and interquartile ranges. * p < 0.05. g-h: Median size of zfl sEVs and whole zfl lEVs during the first 96hpf. Size was determined using NTA. g: Median size of whole zfl lEVs at the 4 observation time points (24 hpf, 48 hpf, 72 hpf, 96 hpf), n = 4. h: Median size of whole zfl sEVs at the 4 observation time points (24 hpf, 48 hpf, 72 hpf, 96 hpf), n = 4. All results are presented as box plots with median, minimum, maximum, and interquartile ranges. * p < 0.05 |