
Fig. 2
- ID
- ZDB-FIG-250311-54
- Publication
- Mulzer et al., 2025 - Dynamic changes of extracellular vesicles during zebrafish organogenesis
- Other Figures
- All Figure Page
- Back to All Figure Page
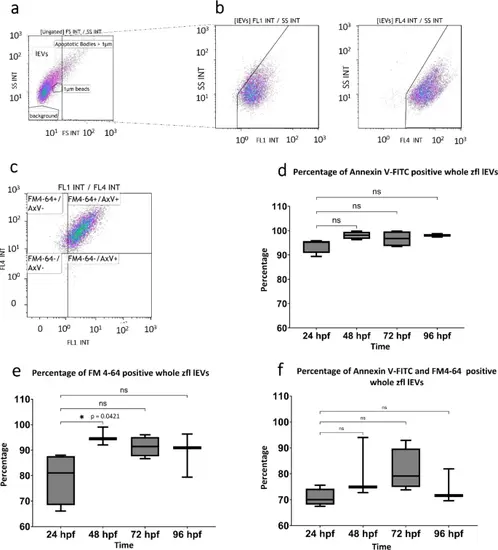
Characterization of whole zfl lEVs using flow cytometry: Gating strategy flow cytometry. a: First we determined the lEV gate by size using a forward scatter below the size of 1 micrometer polystyrene beads (Sigma-Aldrich, Steinheim, Germany) and excluding background signals as shown in the side scatter versus forward scatter plot. b: Further, a polygonal gate was used to exclude events with a higher side scatter, which might be aggregated lEVs. This can be seen in the scatter plots selected for the respective fluorescence: side scatter versus FL1 and side scatter versus FL4. AxV-FITC and/or FM4-64 were added to resuspended 10.000 g homogenized whole zfl pellets, incubated and measured directly and undiluted with flow cytometry. The expression of AxV-FITC and FM4-64 was analysed within these defined lEV gates. Gates defining the respective dye positive fraction were drawn in respect to an obviously negative fraction within the same measurement c: Double positive lEVs were gated in the same way and then analysed in 4 quadrants according to their positivity. FM4-64+/AxV-: lEVs negative for AxV-FITC but positive for FM4-64. FM4-64+/AxV+: lEVs showing positivity for both dyes FM4-64 and AxV-FITC. FM4-64-/AxV-: lEVs neither positive for AxV-FITC nor FM4-64. FM4-64-/AxV+: lEVs negative for FM4-64, but positive for AxV-FITC. d: Percentage of AxV + whole zfl lEVs at the 4 observation time points (24 hpf, 48 hpf, 72 hpf, 96 hpf), n = 4. e: Percentage of FM4-64 + whole zfl lEVs at the 4 observation time points (24 hpf, 48 hpf, 72 hpf, 96 hpf), n = 4. f: Percentage of FM4-64 + and AxV + whole zfl lEVs at the 4 observation time points (24 hpf, 48 hpf, 72 hpf, 96 hpf), n = 4. All results are presented as box plots with median, minimum, maximum, and interquartile ranges. * p < 0.05 |