
- Title
-
Investigating the Effect and Potential Mechanism of Rhamnetin 3-O-α-Rhamnoside on Acute Liver Injury In Vivo and In Vitro
- Authors
- Deng, D., Zhao, B., Yang, H., Wang, S., Geng, Z., Zhou, J., Yang, G., Han, L.
- Source
- Full text @ Pharmaceuticals (Basel)
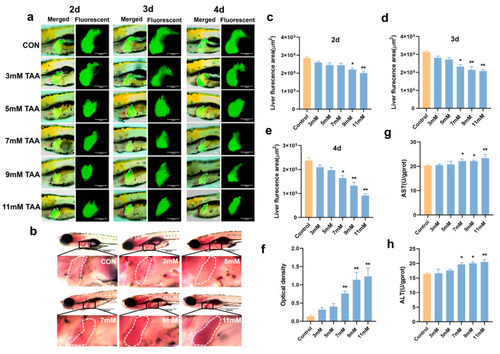
Effects of TAA on the liver of zebrafish larvae. ( |
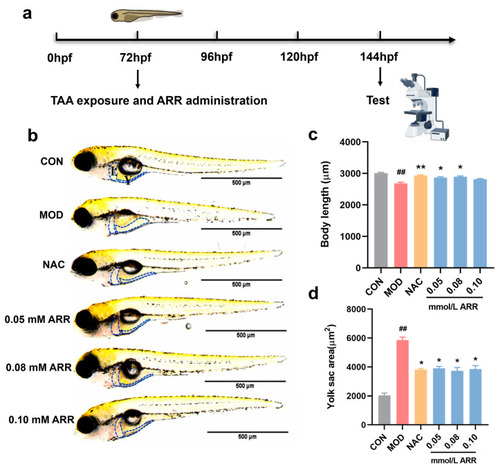
Effects of ARR on TAA-induced zebrafish larvae developmental toxicity. ( |
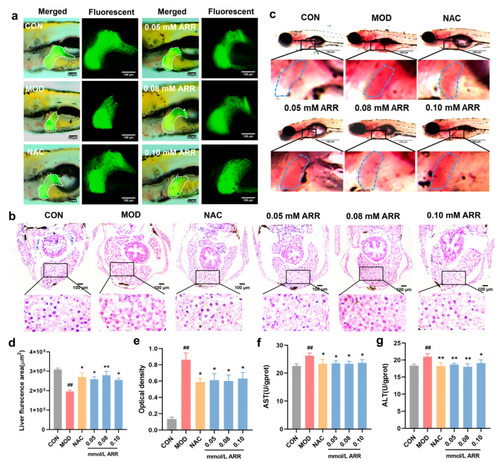
Effects of ARR on TAA-induced liver injury. ( |
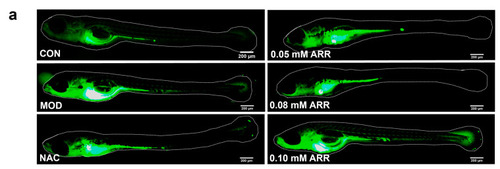
Effects of ARR on oxidative stress induced by TAA in wild-type AB zebrafish. ( |
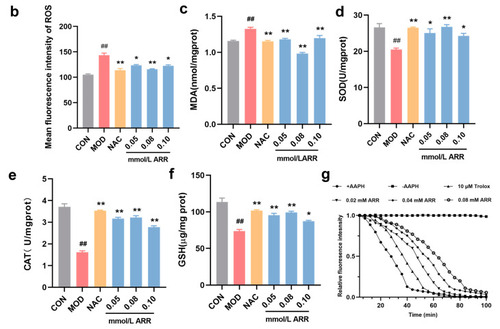
Effects of ARR on oxidative stress induced by TAA in wild-type AB zebrafish. ( |
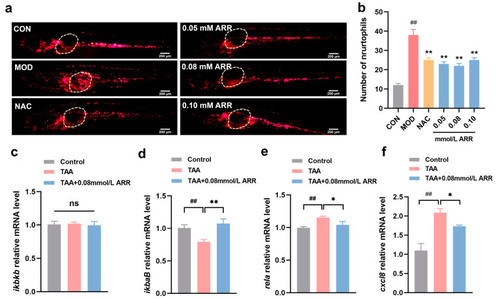
Effects of ARR on TAA-induced inflammation. ( |
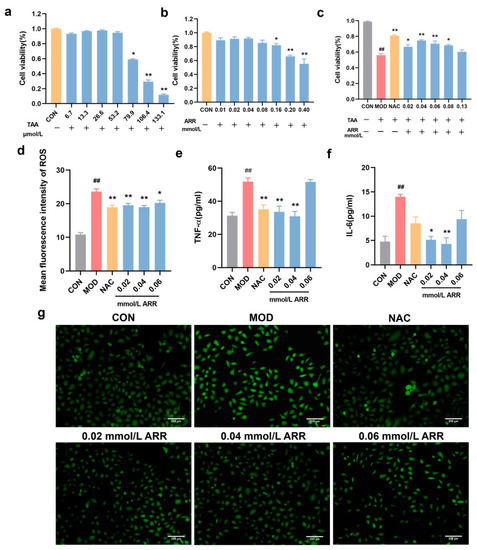
Effects of ARR on TAA-induced levels of ROS and inflammatory factors following TAA induction. ( |
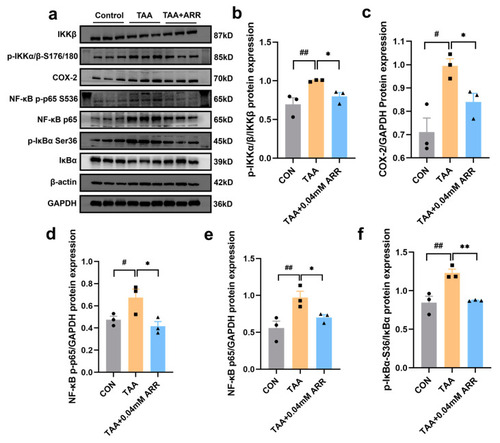
Effects of ARR on TAA-induced activation of IKKβ/NF-κB signaling pathway. ( |
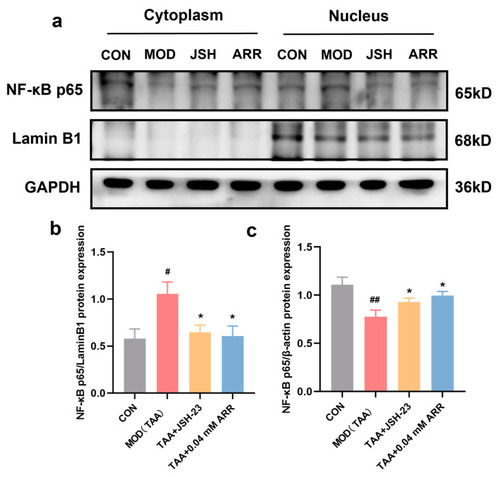
Effect of ARR on nuclear translocation of NF-κB p65. ( |
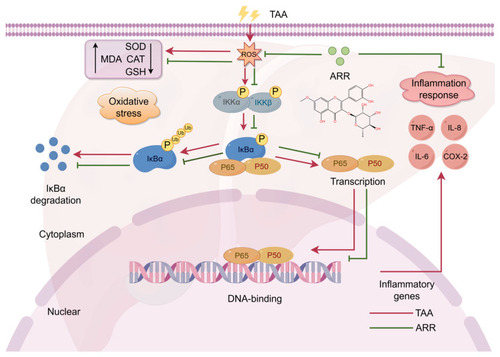
Mechanism of TAA-induced activation of IKKβ/NF-κB signaling pathway inhibition by ARR. |