
- Title
-
Dietary fructose enhances tumour growth indirectly via interorgan lipid transfer
- Authors
- Fowle-Grider, R., Rowles, J.L., Shen, I., Wang, Y., Schwaiger-Haber, M., Dunham, A.J., Jayachandran, K., Inkman, M., Zahner, M., Naser, F.J., Jackstadt, M.M., Spalding, J.L., Chiang, S., McCommis, K.S., Dolle, R.E., Kramer, E.T., Zimmerman, S.M., Souroullas, G.P., Finck, B.N., Shriver, L.P., Kaufman, C.K., Schwarz, J.K., Zhang, J., Patti, G.J.
- Source
- Full text @ Nature
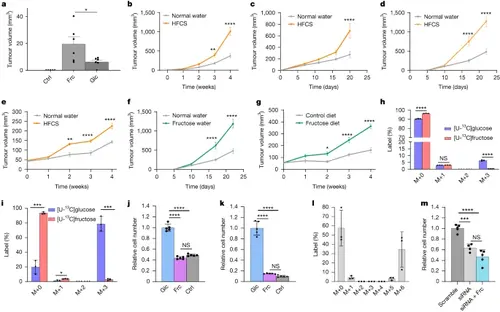
Dietary fructose supports tumour growth in vivo but fructose is not efficiently metabolized by cancer cells in vitro.a, Tumour regrowth 2 weeks after tumour amputation from BRAF/p53 zebrafish in control water (Ctrl, n = 5), water containing fructose (Frc, n = 6) or water containing glucose (Glc, n = 6). No regrowth was detected in the control water condition. Data are representative of two experiments. b–e, Tumour outgrowth after BrafV600EPten−/− melanoma (n = 7) (b), E0771 cells (normal water, n = 10 and HFCS, n = 9) (c), E6/E7-expressing TC-1 cells (normal water, n = 16 and HFCS, n = 13) (d) and CaSki cells (normal water, n = 5 and HFCS, n = 5) (e) were implanted subcutaneously (b,d,e) or into the mammary fat pad (c) of mice supplemented with normal water or 20% HFCS water. f,g, Tumour outgrowth of subcutaneous E6/E7-expressing TC-1 tumours in mice supplemented with normal water (n = 16) or 10% fructose water (n = 13) (f) and of subcutaneous CaSki tumours in mice on a control diet (n = 5) or a high-fructose diet (n = 7) (g). h,i, The isotopologue distribution for lactate from BRAF/p53 zebrafish melanoma cells cultured ex vivo (n = 3) (h) or CaSki cells (n = 3) (i) after 4 h of labelling with 5 mM [U-13C]glucose or 5 mM [U-13C] fructose. j,k, Zcrest C BRAF/p53 zebrafish melanoma cells (n = 5 per condition) (j) and CaSki cells (n = 5 per condition) (k) were cultured in medium with 10 mM glucose (Glc), 10 mM fructose (Frc) or no sugar (Ctrl). l, The isotopologue distribution for endogenous fructose from CaSki cells cultured with [U-13C]glucose (n = 3). m, The relative cell number after administering sorbitol dehydrogenase small interfering RNA (siRNA, n = 4), scrambled control (scramble, n = 5), or sorbitol dehydrogenase siRNA and 10 mM fructose (siRNA + Frc, n = 5) to CaSki cells. Except where indicated, experiments in this figure were performed once. P values were determined using unpaired t-tests comparing the fructose and glucose conditions (a), two-way analysis of variance (ANOVA) with Šídák’s multiple-comparisons test (b–g), multiple unpaired t-tests (h and i) or ordinary one-way ANOVA with Tukey’s multiple-comparisons test (j, k and m); *P < 0.05, **P < 0.01, ***P < 0.001, ****P < 0.0001; NS, not significant. Data are mean ± s.e.m (b–g) and mean ± s.d. (a and h–m). PHENOTYPE:
|
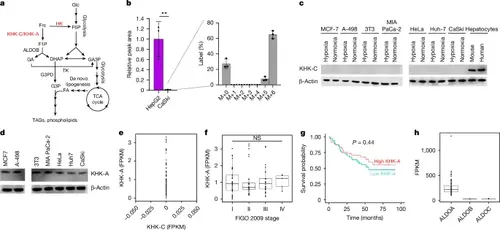
Transformed cells express KHK-A but not KHK-C.a, Schematic of fructose metabolism through hexokinase, KHK-C and KHK-A. F6P, fructose 6-phosphate; HK, hexokinase; F1P, fructose 1-phosphate; ALDOB, aldolase B; GA, glyceraldehyde; DHAP, dihydroxyacetone phosphate; GA3P, glyceraldehyde 3-phosphate; TK, triokinase; G3P, glycerol 3-phosphate; G3PD, glycerol 3-phosphate dehydrogenase; FA, fatty acid; TCA, tricarboxylic acid; TAG, triacylglycerol. b, Relative peak area of M+6 fructose 1-phosphate in CaSki cells (n = 3) compared with HepG2 hepatocytes (n = 3) administered 5 mM [U- 3C]fructose for 4 h. The pool of labelled fructose 1-phosphate is orders of magnitude larger in HepG2 hepatocytes, but the inset shows that fructose 1-phosphate is 13C-labelled in CaSki cells after 4 h of being cultured with 5 mM [U-13C]fructose (n = 3). c, Western blot analysis of KHK-C from the indicated cell lines or primary cells. d, Western blot analysis of KHK-A from the indicated cell lines. For e–h, data are from 99 patients treated at Washington University School of Medicine. e, The relative expression levels of KHK-A and KHK-C from patient cervical tumours. f, Patient cervical tumour stages and KHK-A isoform expression. g, Kaplan–Meier plot of the overall survival rate of patients expressing high levels of KHK-A or low levels of KHK-A. h, The relative expression levels of ALDOA, ALDOB and ALDOC from patient cervical tumours. Data in c and d are representative of two experiments. All other experiments were performed once. P values were determined using two-sided t-tests (b) and ordinary one-way ANOVA with Tukey’s multiple-comparisons test (f). Survival curves were generated using a log-rank test (g). For b, data are mean ± s.d. For the box plots in f and h, the box limits extend from the 25th to 75th percentiles, the centre line shows the median and the whiskers (f) extend to the largest and smallest values up to 1.5× the interquartile range. |
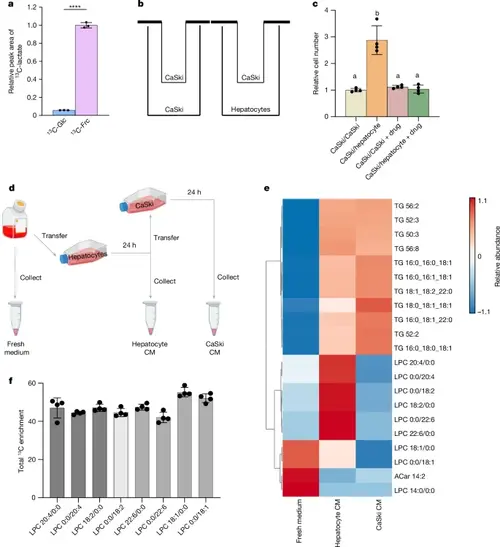
Hepatocytes transform fructose into other nutrients that support cancer cell proliferation.a, The relative pool size of 13C-labelled lactate (M+3) from the medium after administering 5 mM [U-13C]glucose (13C-Glc, n = 3) or 5 mm [U-13C]fructose (13C-Frc, n = 3) to primary mouse hepatocytes for 4 h. b, Schematic of the Transwell co-culture experiment for CaSki + CaSki (control) or CaSki + hepatocytes. c, The relative number of CaSki cells in the indicated co-culture conditions treated with or without PF-06835919 (drug). n = 4 per condition. d, Schematic of the generation of hepatocyte CM, CaSki CM and fresh medium for lipid analysis. Fresh medium contained 10 mM fructose as the only carbohydrate source. The image was created using BioRender. e, Heat map of the significant metabolite pool-size differences among the experimental conditions outlined in d: fresh medium (n = 3), hepatocyte CM (n = 6) and CaSki CM (n = 4). Red indicates a larger pool size. Blue indicates a smaller pool size. aCar, acylcarnitine; TG, triacylglycerol. f, Total 13C-labelling of LPCs from primary mouse hepatocytes (n = 4) administered 10 mM [U-13C] fructose. All experiments in this figure were performed once. P values were determined using two-sided t-tests (a) and ordinary one-way ANOVA with Tukey’s multiple-comparisons test (c). In c, conditions with the same letter above the bar have no significant difference, and bars with different letters have P < 0.05. For e, significant metabolites were determined using one-way ANOVA (FDR < 0.05). For a, c, and f, data are mean ± s.d. |
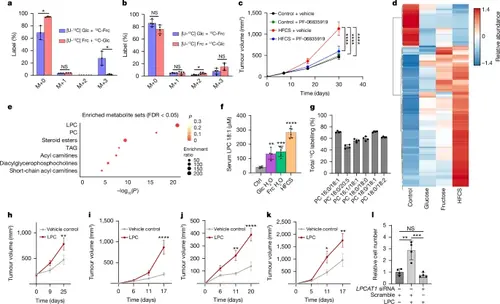
Organismal metabolism of fructose drives tumour growth.a,b, The isotopologue distribution for lactate from CaSki xenografts after introduction of 1:1 [U-13C]glucose:12C-fructose or 1:1 [U-13C]fructose:12C-glucose through direct intratumoural injection (n = 3 for each tracer) (a) or oral gavage (n = 4 for each tracer). 12C-fructose (12C-Frc) and 12C-glucose (12C-Glc) indicates unlabelled fructose and glucose, respectively (b). c, Tumour outgrowth of E6/E7-expressing TC-1 subcutaneous tumours after administration of PF-06835919 (n = 6 each drug condition) or vehicle (n = 8 each vehicle condition) to mice on normal water (control) or 20% HFCS water. d, Heat map of significant serum lipids from C57BL/6 mice on normal water (n = 4), 10% glucose water (n = 4), 10% fructose water (n = 5) or 20% HFCS water (n = 6) for 6 weeks. e, Metabolite set enrichment analyses of mice on normal water (n = 4) or 20% HFCS water (n = 6). The significant lipid classes increased in the 20% HFCS condition are shown. f, Quantification of LPC 18:1 from the serum of mice under the same conditions as in d. g, Total 13C labelling, corrected for natural 13C abundance, of various PCs from E6/E7-expressing TC-1 subcutaneous tumours in mice (n = 4) on 5% [U-13C]fructose water for 120 h. h–k, Tumour outgrowth from mice bearing CaSki (h), TC-1 (i), E0771 (j), or C57BL/6 melanoma (k). Animals were administered 80 mg per kg LPC 18:1 (n = 7–8) or vehicle (n = 7). Mice bearing CaSki tumours were administered 80 mg per kg LPC extract from soybean (n = 13) or a vehicle injection (n = 12). l, Relative cell number after administering LPCAT1 siRNA or scrambled control siRNA with or without 25 μM LPC 18:1 as indicated (n = 4). Data in l are representative of two experiments. All other experiments were performed once. P values were determined using multiple unpaired t-tests (a and b), ordinary one-way ANOVA with Tukey’s multiple-comparisons test of AUC (c) or relative cell number (l), ordinary one-way ANOVA with Dunnett’s multiple-comparisons test (f) or two-way ANOVA with Šídák’s multiple-comparisons test (h–k). In d, only significant metabolites as determined by using a one-way ANOVA (FDR < 0.05) are shown. P < 0.05. Data are mean ± s.e.m. (c and h–k) and mean ± s.d. (a, b, f, g and l). |