
Fig. 2
- ID
- ZDB-FIG-250221-58
- Publication
- Fowle-Grider et al., 2024 - Dietary fructose enhances tumour growth indirectly via interorgan lipid transfer
- Other Figures
- All Figure Page
- Back to All Figure Page
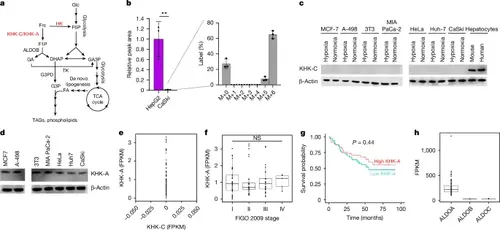
Transformed cells express KHK-A but not KHK-C.a, Schematic of fructose metabolism through hexokinase, KHK-C and KHK-A. F6P, fructose 6-phosphate; HK, hexokinase; F1P, fructose 1-phosphate; ALDOB, aldolase B; GA, glyceraldehyde; DHAP, dihydroxyacetone phosphate; GA3P, glyceraldehyde 3-phosphate; TK, triokinase; G3P, glycerol 3-phosphate; G3PD, glycerol 3-phosphate dehydrogenase; FA, fatty acid; TCA, tricarboxylic acid; TAG, triacylglycerol. b, Relative peak area of M+6 fructose 1-phosphate in CaSki cells (n = 3) compared with HepG2 hepatocytes (n = 3) administered 5 mM [U- 3C]fructose for 4 h. The pool of labelled fructose 1-phosphate is orders of magnitude larger in HepG2 hepatocytes, but the inset shows that fructose 1-phosphate is 13C-labelled in CaSki cells after 4 h of being cultured with 5 mM [U-13C]fructose (n = 3). c, Western blot analysis of KHK-C from the indicated cell lines or primary cells. d, Western blot analysis of KHK-A from the indicated cell lines. For e–h, data are from 99 patients treated at Washington University School of Medicine. e, The relative expression levels of KHK-A and KHK-C from patient cervical tumours. f, Patient cervical tumour stages and KHK-A isoform expression. g, Kaplan–Meier plot of the overall survival rate of patients expressing high levels of KHK-A or low levels of KHK-A. h, The relative expression levels of ALDOA, ALDOB and ALDOC from patient cervical tumours. Data in c and d are representative of two experiments. All other experiments were performed once. P values were determined using two-sided t-tests (b) and ordinary one-way ANOVA with Tukey’s multiple-comparisons test (f). Survival curves were generated using a log-rank test (g). For b, data are mean ± s.d. For the box plots in f and h, the box limits extend from the 25th to 75th percentiles, the centre line shows the median and the whiskers (f) extend to the largest and smallest values up to 1.5× the interquartile range. |