
|
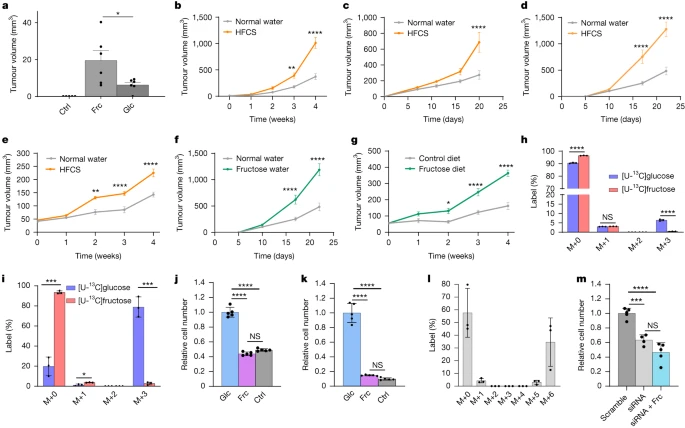
Fig. 1 Dietary fructose supports tumour growth in vivo but fructose is not efficiently metabolized by cancer cells in vitro.a, Tumour regrowth 2 weeks after tumour amputation from BRAF/p53 zebrafish in control water (Ctrl, n = 5), water containing fructose (Frc, n = 6) or water containing glucose (Glc, n = 6). No regrowth was detected in the control water condition. Data are representative of two experiments. b–e, Tumour outgrowth after BrafV600EPten−/− melanoma (n = 7) (b), E0771 cells (normal water, n = 10 and HFCS, n = 9) (c), E6/E7-expressing TC-1 cells (normal water, n = 16 and HFCS, n = 13) (d) and CaSki cells (normal water, n = 5 and HFCS, n = 5) (e) were implanted subcutaneously (b,d,e) or into the mammary fat pad (c) of mice supplemented with normal water or 20% HFCS water. f,g, Tumour outgrowth of subcutaneous E6/E7-expressing TC-1 tumours in mice supplemented with normal water (n = 16) or 10% fructose water (n = 13) (f) and of subcutaneous CaSki tumours in mice on a control diet (n = 5) or a high-fructose diet (n = 7) (g). h,i, The isotopologue distribution for lactate from BRAF/p53 zebrafish melanoma cells cultured ex vivo (n = 3) (h) or CaSki cells (n = 3) (i) after 4 h of labelling with 5 mM [U-13C]glucose or 5 mM [U-13C] fructose. j,k, Zcrest C BRAF/p53 zebrafish melanoma cells (n = 5 per condition) (j) and CaSki cells (n = 5 per condition) (k) were cultured in medium with 10 mM glucose (Glc), 10 mM fructose (Frc) or no sugar (Ctrl). l, The isotopologue distribution for endogenous fructose from CaSki cells cultured with [U-13C]glucose (n = 3). m, The relative cell number after administering sorbitol dehydrogenase small interfering RNA (siRNA, n = 4), scrambled control (scramble, n = 5), or sorbitol dehydrogenase siRNA and 10 mM fructose (siRNA + Frc, n = 5) to CaSki cells. Except where indicated, experiments in this figure were performed once. P values were determined using unpaired t-tests comparing the fructose and glucose conditions (a), two-way analysis of variance (ANOVA) with Šídák’s multiple-comparisons test (b–g), multiple unpaired t-tests (h and i) or ordinary one-way ANOVA with Tukey’s multiple-comparisons test (j, k and m); *P < 0.05, **P < 0.01, ***P < 0.001, ****P < 0.0001; NS, not significant. Data are mean ± s.e.m (b–g) and mean ± s.d. (a and h–m).