
Fig. 4
- ID
- ZDB-FIG-250221-60
- Publication
- Fowle-Grider et al., 2024 - Dietary fructose enhances tumour growth indirectly via interorgan lipid transfer
- Other Figures
- All Figure Page
- Back to All Figure Page
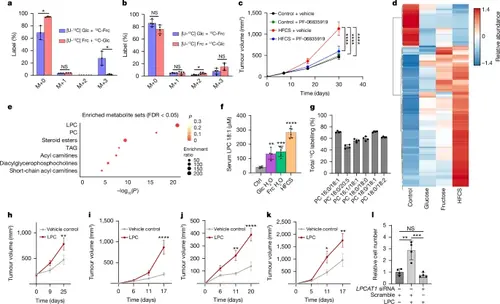
Organismal metabolism of fructose drives tumour growth.a,b, The isotopologue distribution for lactate from CaSki xenografts after introduction of 1:1 [U-13C]glucose:12C-fructose or 1:1 [U-13C]fructose:12C-glucose through direct intratumoural injection (n = 3 for each tracer) (a) or oral gavage (n = 4 for each tracer). 12C-fructose (12C-Frc) and 12C-glucose (12C-Glc) indicates unlabelled fructose and glucose, respectively (b). c, Tumour outgrowth of E6/E7-expressing TC-1 subcutaneous tumours after administration of PF-06835919 (n = 6 each drug condition) or vehicle (n = 8 each vehicle condition) to mice on normal water (control) or 20% HFCS water. d, Heat map of significant serum lipids from C57BL/6 mice on normal water (n = 4), 10% glucose water (n = 4), 10% fructose water (n = 5) or 20% HFCS water (n = 6) for 6 weeks. e, Metabolite set enrichment analyses of mice on normal water (n = 4) or 20% HFCS water (n = 6). The significant lipid classes increased in the 20% HFCS condition are shown. f, Quantification of LPC 18:1 from the serum of mice under the same conditions as in d. g, Total 13C labelling, corrected for natural 13C abundance, of various PCs from E6/E7-expressing TC-1 subcutaneous tumours in mice (n = 4) on 5% [U-13C]fructose water for 120 h. h–k, Tumour outgrowth from mice bearing CaSki (h), TC-1 (i), E0771 (j), or C57BL/6 melanoma (k). Animals were administered 80 mg per kg LPC 18:1 (n = 7–8) or vehicle (n = 7). Mice bearing CaSki tumours were administered 80 mg per kg LPC extract from soybean (n = 13) or a vehicle injection (n = 12). l, Relative cell number after administering LPCAT1 siRNA or scrambled control siRNA with or without 25 μM LPC 18:1 as indicated (n = 4). Data in l are representative of two experiments. All other experiments were performed once. P values were determined using multiple unpaired t-tests (a and b), ordinary one-way ANOVA with Tukey’s multiple-comparisons test of AUC (c) or relative cell number (l), ordinary one-way ANOVA with Dunnett’s multiple-comparisons test (f) or two-way ANOVA with Šídák’s multiple-comparisons test (h–k). In d, only significant metabolites as determined by using a one-way ANOVA (FDR < 0.05) are shown. P < 0.05. Data are mean ± s.e.m. (c and h–k) and mean ± s.d. (a, b, f, g and l). |