- Title
-
Using Zebrafish G Protein-Coupled Receptors to Obtain a Better Appreciation of the Impact of Pharmaceuticals in Wastewater to Fish
- Authors
- Zhang, H., Cao, M., Ihara, M.O., Jürgens, M.D., Johnson, A.C., Chen, J., Tanaka, H., Ihara, M.
- Source
- Full text @ Env. Sci. Tech.
|
IC50 values of GPCR-acting pharmaceuticals against human (hD2, hβ1, and hH1) and zebrafish (zD2a, zD2c, zβ1, and zH1) receptors. Plots indicate the mean IC50 values (M) of GPCR-acting pharmaceuticals measured in the present study. Red (zD2a, zβ1, and zH1) and blue (zD2c) plots are IC50 values for zebrafish GPCRs, and black plots indicate IC50 values for zebrafish GPCRs (hD2, hβ1, and hH1). Red open circle indicates that the IC50 was >10–5 M; atenolol against zβ1 receptor did not reach 50% AP-TGFα release in the tested concentration range (10–10 to 10–5 M). The IC50 values of GPCR-acting pharmaceuticals against human GPCRs (hD2, hβ1, and hH1) were cited from our previous study. (28) |
|
Comparison of IC50 values of pharmaceuticals between human and zebrafish GPCRs plots indicate the ratio of IC50 values of pharmaceuticals against human and zebrafish GPCRs. Ratio > 1 indicates that zebrafish GPCRs were more strongly inhibited by pharmaceuticals; <1 indicates that human GPCRs were more strongly inhibited by pharmaceuticals. Red open circle indicates that the ratio was below 0.01 because the IC50 of atenolol against zβ1 receptor was not detected in the tested concentration range. |
|
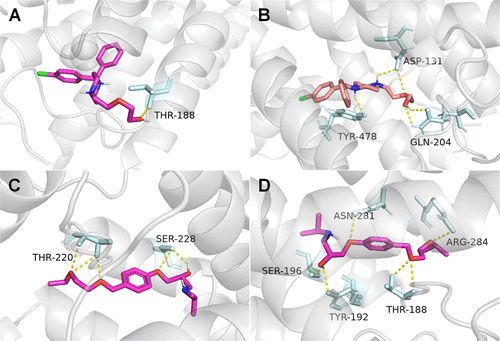
Molecular docking of ligand–GPCR interactions. Most favorable docking positions for hydroxyzine with the (A) hH1 and (B) zH1-active regions, and for bisoprolol with the (C) hβ1 and (D) zβ1-active regions. The homology models of zH1, hβ1, and zβ1 were generated by the SWISS-MODEL (Figure S5). The ligand for hH1 and zH1 was hydroxyzine, and the ligand for hβ1 and zβ1 was bisoprolol. Yellow dashed lines indicate hydrogen bonds between the ligand and amino acid residues. The amino acid residues which formed hydrogen bonds are shown in the figures. |
|
Prioritization of pharmaceuticals in effluents in England and Japan based on predicted antagonistic EQs against human and zebrafish receptors. Bars indicate predicted antagonistic EQs of each GPCR-acting pharmaceutical in effluents. For each GPCR, overall predicted antagonistic EQs are the sum of individual activities of the most consumed pharmaceuticals against each receptor following the concentration addition model. Parentheses show the unit and corresponding reference antagonistic pharmaceuticals for each receptor. |
|
Measured antagonistic EQs against human receptors (hD2, hβ1, and hH1) and zebrafish receptors (zD2a, zD2c, zβ1, and zH1) in effluent extracts. Plots represent mean ± standard error of the mean (SEM), n = 6. Lines are the limit of detection (LOD) of activities. |


