
FIGURE
Fig. 3
- ID
- ZDB-FIG-250217-42
- Publication
- Zhang et al., 2024 - Using Zebrafish G Protein-Coupled Receptors to Obtain a Better Appreciation of the Impact of Pharmaceuticals in Wastewater to Fish
- Other Figures
- All Figure Page
- Back to All Figure Page
Fig. 3
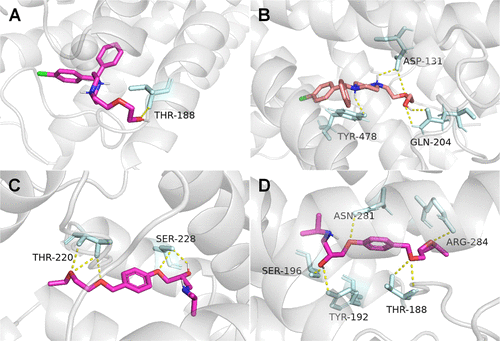
Molecular docking of ligand–GPCR interactions. Most favorable docking positions for hydroxyzine with the (A) hH1 and (B) zH1-active regions, and for bisoprolol with the (C) hβ1 and (D) zβ1-active regions. The homology models of zH1, hβ1, and zβ1 were generated by the SWISS-MODEL (Figure S5). The ligand for hH1 and zH1 was hydroxyzine, and the ligand for hβ1 and zβ1 was bisoprolol. Yellow dashed lines indicate hydrogen bonds between the ligand and amino acid residues. The amino acid residues which formed hydrogen bonds are shown in the figures. |
Expression Data
Expression Detail
Antibody Labeling
Phenotype Data
Phenotype Detail
Acknowledgments
This image is the copyrighted work of the attributed author or publisher, and
ZFIN has permission only to display this image to its users.
Additional permissions should be obtained from the applicable author or publisher of the image.
Full text @ Env. Sci. Tech.