
- Title
-
Dynamics of thermal tolerance plasticity across fish species and life stages
- Authors
- De Bonville, J., Andreassen, A.H., Cowan, Z.L., Silva-Garay, L., Leeuwis, R.H.J., Åsheim, E.R., Speers-Roesch, B., Raby, G.D., Binning, S.A., Jutfelt, F.
- Source
- Full text @ J. Therm. Biol.
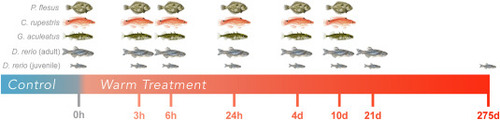
Experimental design showing the four fish species and two life stages of zebrafish used in the study on a logged time scale representing acclimation duration. Fishes were initially held at a control temperature representing ambient conditions during capture in the wild (16 °C: wrasse; 18 °C: stickleback and flounder) or rearing temperatures in the lab (28 °C: zebrafish) and then were transferred to a warm treatment of either +5 °C (wrasse, stickleback and flounder) or +6 °C (zebrafish). At each time point, CTmax was assessed for all species, and CTmax as well as CTmin were assessed for both life stages of zebrafish. |

CTmax of three marine species (European flounder Platichthys flesus, goldsinny wrasse Ctenolabrus rupestris and three-spined stickleback Gasterosteus aculeatus) during a 10 day acclimation to a warm (+5 °C) treatment. Individuals are represented by small transparent points. Larger dark points represent the mean for each group and error bars indicate the 95% confidence intervals. Trials conducted at 0 h (in light grey) represent thermal tolerance at the control holding temperature (wrasses: 16 °C, flounders and sticklebacks: 18 °C), for comparison against the warm treatment (wrasses: 21 °C, flounders and sticklebacks: 23 °C). Although acclimation duration is used as a categorical factor, it is displayed on a logarithmic scale to help visualize differences in time among groups. For each species, letters represent significant differences between the means of each group (Tukey's post-hoc test, p < 0.05). |
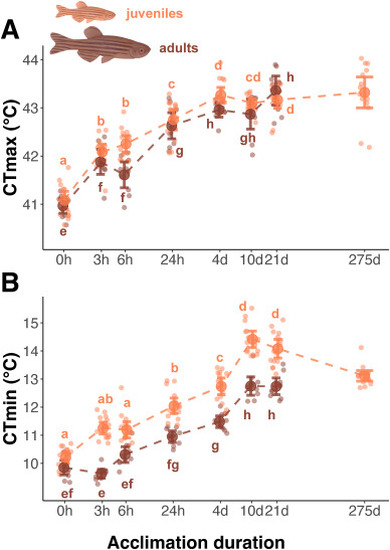
CTmax (A) and CTmin (B) of adult and juvenile zebrafish (Danio rerio) during acclimation to a warm (+6 °C; 28 °C at 0 h to 34 °C for subsequent durations) treatment. Individuals are represented by small transparent points. Larger dark points represent the mean for each group and error bars indicate the 95% confidence intervals. Acclimation duration is displayed on a logarithmic scale to help visualize differences in time among categorical groups. For each life stage, letters represent significant differences between the means of each group (Tukey's post-hoc test, p < 0.05; a–d for juveniles, e–h for adults). |
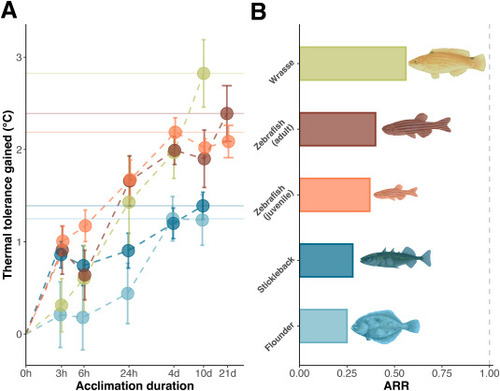
(A) Thermal tolerance gained (TTgain) through 10 days of acclimation to a warm treatment for species from experiment 1 and up to 21 days for experiment 2 (zebrafish). The mean TTgain for each species is represented as a point at each acclimation duration. Points are slightly jittered horizontally to reduce overlap. Error bars indicate 95% confidence intervals of means. Dotted lines between the means were added for visual purposes. Horizontal lines indicate the maximum TTgain for each species. Acclimation duration is displayed on a logarithmic scale to help visualize differences in time among categorical groups. (B) ARR shown for the different species and life stages tested. ARR was calculated by using the maximum thermal tolerance gained. The dotted line at 1.00 represents a perfect thermal compensation. |