
Fig. 4
- ID
- ZDB-FIG-250327-98
- Publication
- De Bonville et al., 2024 - Dynamics of thermal tolerance plasticity across fish species and life stages
- Other Figures
- All Figure Page
- Back to All Figure Page
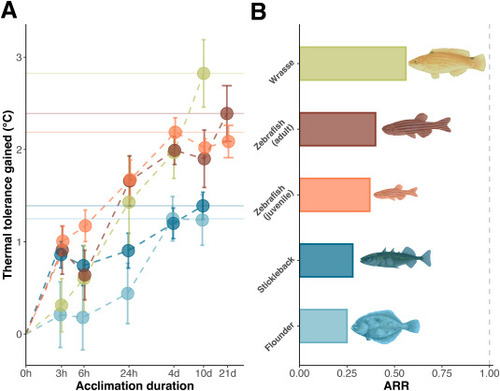
(A) Thermal tolerance gained (TTgain) through 10 days of acclimation to a warm treatment for species from experiment 1 and up to 21 days for experiment 2 (zebrafish). The mean TTgain for each species is represented as a point at each acclimation duration. Points are slightly jittered horizontally to reduce overlap. Error bars indicate 95% confidence intervals of means. Dotted lines between the means were added for visual purposes. Horizontal lines indicate the maximum TTgain for each species. Acclimation duration is displayed on a logarithmic scale to help visualize differences in time among categorical groups. (B) ARR shown for the different species and life stages tested. ARR was calculated by using the maximum thermal tolerance gained. The dotted line at 1.00 represents a perfect thermal compensation. |