
Fig. 1
- ID
- ZDB-FIG-250327-95
- Publication
- De Bonville et al., 2024 - Dynamics of thermal tolerance plasticity across fish species and life stages
- Other Figures
- All Figure Page
- Back to All Figure Page
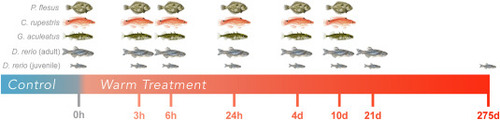
Experimental design showing the four fish species and two life stages of zebrafish used in the study on a logged time scale representing acclimation duration. Fishes were initially held at a control temperature representing ambient conditions during capture in the wild (16 °C: wrasse; 18 °C: stickleback and flounder) or rearing temperatures in the lab (28 °C: zebrafish) and then were transferred to a warm treatment of either +5 °C (wrasse, stickleback and flounder) or +6 °C (zebrafish). At each time point, CTmax was assessed for all species, and CTmax as well as CTmin were assessed for both life stages of zebrafish. |