
|
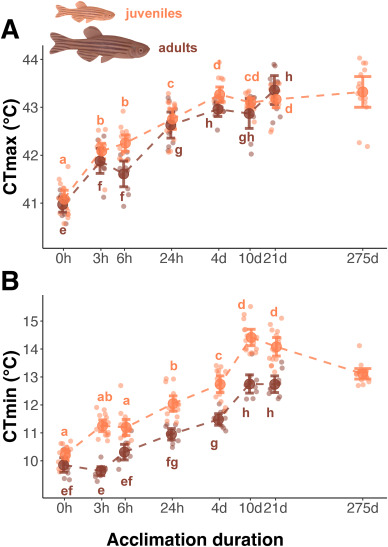
Fig. 3 CTmax (A) and CTmin (B) of adult and juvenile zebrafish (Danio rerio) during acclimation to a warm (+6 °C; 28 °C at 0 h to 34 °C for subsequent durations) treatment. Individuals are represented by small transparent points. Larger dark points represent the mean for each group and error bars indicate the 95% confidence intervals. Acclimation duration is displayed on a logarithmic scale to help visualize differences in time among categorical groups. For each life stage, letters represent significant differences between the means of each group (Tukey's post-hoc test, p < 0.05; a–d for juveniles, e–h for adults).