
|
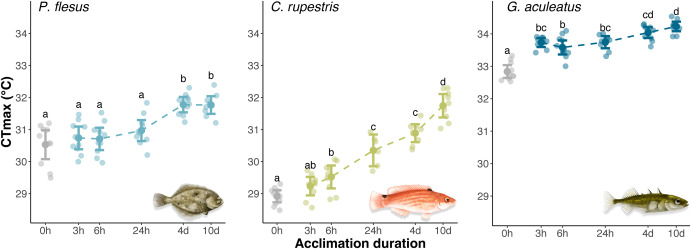
Fig. 2 CTmax of three marine species (European flounder Platichthys flesus, goldsinny wrasse Ctenolabrus rupestris and three-spined stickleback Gasterosteus aculeatus) during a 10 day acclimation to a warm (+5 °C) treatment. Individuals are represented by small transparent points. Larger dark points represent the mean for each group and error bars indicate the 95% confidence intervals. Trials conducted at 0 h (in light grey) represent thermal tolerance at the control holding temperature (wrasses: 16 °C, flounders and sticklebacks: 18 °C), for comparison against the warm treatment (wrasses: 21 °C, flounders and sticklebacks: 23 °C). Although acclimation duration is used as a categorical factor, it is displayed on a logarithmic scale to help visualize differences in time among groups. For each species, letters represent significant differences between the means of each group (Tukey's post-hoc test, p < 0.05).