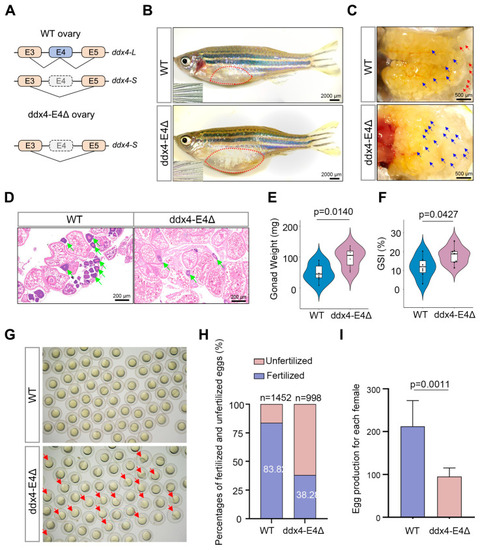
ddx4-L knockout causes reduced fecundity of female zebrafish. (A) Alternative splicing patterns of ddx4 in WT and ddx4-E4Δ zebrafish ovaries are shown. (B) Abdominal morphology and secondary sexual characteristics of WT and ddx4-E4Δ zebrafish at 9 mpf. The insets show the pectoral fin of zebrafish. Red dotted frames indicate the position of ovaries. n = 7. Scale bars: 2000 μm. (C) Overall ovarian morphology of WT and ddx4-E4Δ zebrafish at 9 mpf. The red arrows indicate examples of mature eggs, and the blue arrows indicate examples of immature eggs. n = 7. Scale bars: 500 μm. (D) Hematoxylin and eosin (HE) staining of WT and ddx4-E4Δ ovarian sections at 9 mpf. The green arrows indicate early-stage oocytes, which have large, spherical nuclei stained blue or purple due to the high affinity of hematoxylin. n = 7. Scale bars: 200 μm. (E) Ovarian weights of WT and ddx4-E4Δ zebrafish at 9 mpf are shown. n = 7. (F) GSI of WT and ddx4-E4Δ females at 9 mpf are shown. n = 7. (G) Embryos produced by WT and ddx4-E4Δ zebrafish are shown. The arrows indicate the unfertilized embryos. (H) Fertilization rates of spawning eggs were quantified for WT and ddx4-E4Δ zebrafish. (I) The number of eggs produced by a single female during a spawning cycle was quantified. The ddx4-E4Δ females laid fewer eggs than WT controls. n = 6.

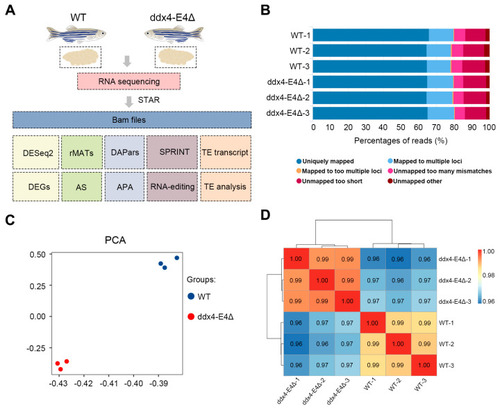
RNA sequencing of WT and ddx4-E4Δ zebrafish ovaries. (A) The workflow of RNA sequencing and bioinformatics analysis. Three biological replicates were employed in each experimental group. (B) Quality control of the RNA-seq raw data. The mapping rate of each sample is shown. (C) PCA analysis of WT and ddx4-E4Δ samples. (D) Correlation heatmap of WT and ddx4-E4Δ samples.

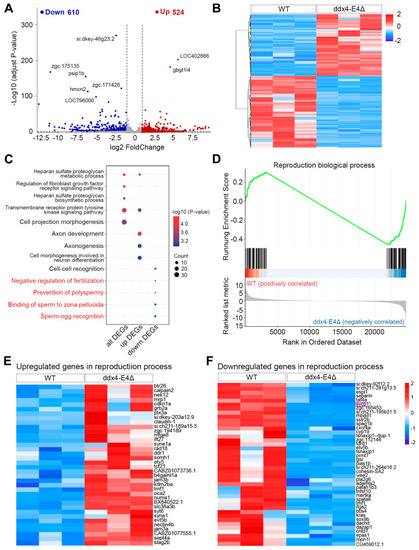
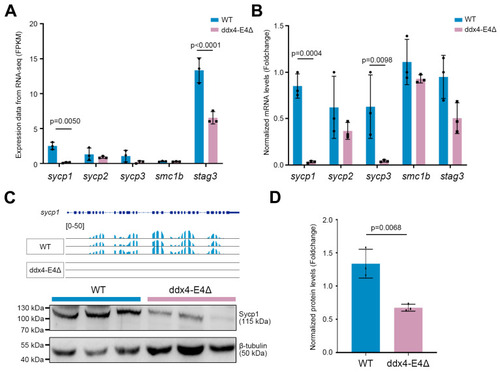
Identification and functional enrichment analysis of DEGs between WT and ddx4-E4Δ zebrafish ovaries. (A) The volcano plot shows the 524 upregulated and 610 downregulated genes in ddx4-E4Δ ovaries. (B) The heatmap shows the expression pattern of DEGs between WT and ddx4-E4Δ ovaries. (C) Enriched GO terms in all, upregulated, and downregulated DEGs, respectively. (D) GSEA analysis shows the global upregulation of genes involved in reproduction biological process. (E) The expression pattern of upregulated genes in the reproduction biological process term. (F) The expression pattern of downregulated genes in the reproduction biological process term. The purple box indicates the significantly down-regulated meiosis-related gene sycp1.

ddx4-L knockout leads to significant downregulation of sycp1 at mRNA and protein levels. (A) Expression levels of several meiosis-related genes in WT and ddx4-E4Δ ovaries based on the RNA-seq data. The FPKM values are shown. n = 3. (B) qPCR validation of the mRNA levels of meiosis-related genes in WT and ddx4-E4Δ ovaries at 6 mpf. n = 3. (C) Detection of Sycp1 protein levels in WT and ddx4-E4Δ ovaries at 6 mpf by Western blot assay. RNA-seq tracks of sycp1 gene in WT and ddx4-E4Δ ovaries are shown in the top panel. Original western blot images are shown in Figure S1A. (D) Quantitative analysis of the bands in (C) shows the changes in Sycp1 protein levels in ddx4-E4Δ ovaries. n = 3.

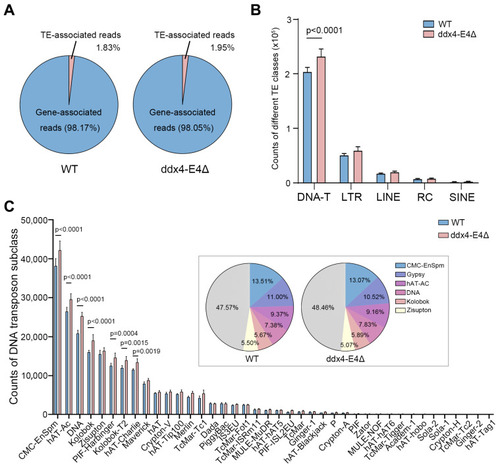
Identification of TEs and quantitative analysis of TE expression in WT and ddx4-E4Δ zebrafish ovaries. (A) The percentages of RNA-seq reads belonging to TEs in WT and ddx4-E4Δ ovaries. (B) Count numbers of different subcategories of TEs identified in WT and ddx4-E4Δ ovaries by RNA-seq. (C) Count numbers of DNA transposon subclasses in WT and ddx4-E4Δ ovaries.

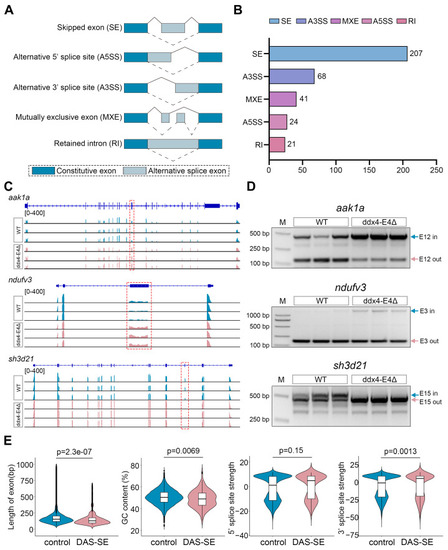
Identification of differential alternative splicing events between WT and ddx4-E4Δ zebrafish ovaries. (A) Five types of alternative splicing events analyzed in this study are shown. (B) The numbers of DASEs for each AS type between WT and ddx4-E4Δ ovaries are shown. (C) RNA-seq tracks of aak1a, ndufv3, and sh3d21 are shown. The alternative exons are indicated with boxes. (D) RT-PCR validation of the three selected DASEs. Original gel images are shown in Figure S1B. (E) The differentially spliced exons affected by ddx4-L knockout have relatively shorter length, higher GC contents, similar 5′ splicing sites, and stronger 3′ splicing sites.

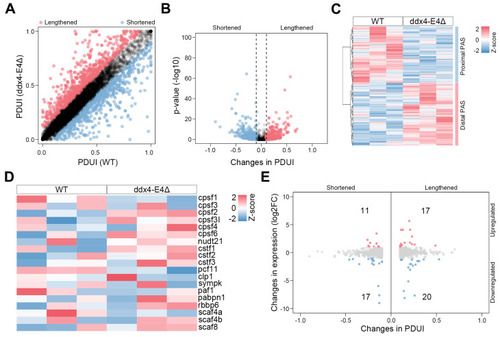
Identification of APA events between WT and ddx4-E4Δ zebrafish ovaries. (A) A plot of PDUI score of each gene in WT and ddx4-E4Δ groups. Grey dots indicate APA events showing no difference between WT and ddx4-E4Δ ovaries. (B) A volcano plot denoting 3′UTR-shorterned (blue) and -lengthened (red) gene hits. Grey dots indicate APA events showing no difference between WT and ddx4-E4Δ ovaries. (C) Heatmap of proximal and distal PAS usage. (D) Expression profile of key APA factors. (E) Log-fold change in gene expression is plotted against ΔPDUI for 3′UTR-altered genes. Grey dots indicate differential APA events that do not affect gene expression.

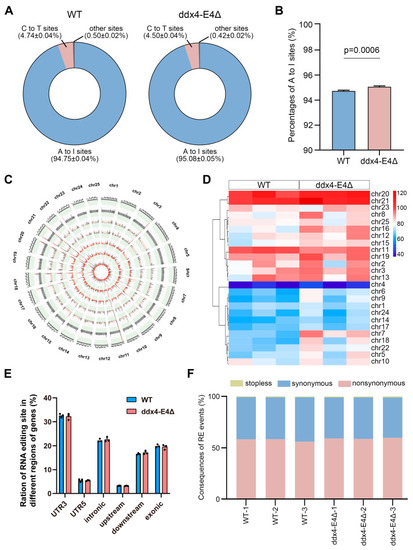
Identification of RNA editing events in WT and ddx4-E4Δ zebrafish ovaries. (A) Percentages of A-to-I, C-to-T, and other types of RNA editing events. (B) Proportion of A-to-I RNA editing events. (C) Distribution of RNA editing events on each chromosome. The RNA editing levels are shown with red bars. (D) The number of RNA editing sites on unite chromosome length of 25 chromosomes. (E) Distribution of the RNA editing sites in different regions of genes in WT and ddx4-E4Δ ovaries. (F) Functional consequences of the RNA editing sites located in CDSs.

Acknowledgments
This image is the copyrighted work of the attributed author or publisher, and ZFIN has permission only to display this image to its users. Additional permissions should be obtained from the applicable author or publisher of the image. Full text @ Biology (Basel)