IMAGE

Figure 3

ID
ZDB-IMAGE-250110-96
Source
Figures for Chen et al., 2024
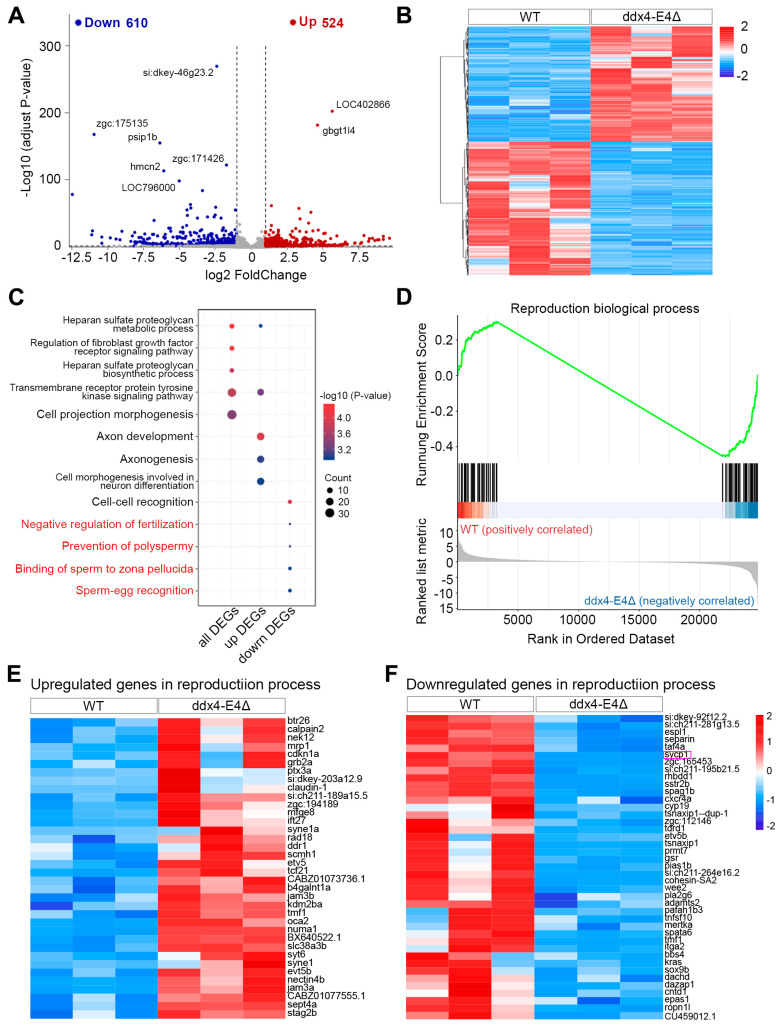
Image
Figure Caption

Figure 3

Identification and functional enrichment analysis of DEGs between WT and ddx4-E4Δ zebrafish ovaries. (A) The volcano plot shows the 524 upregulated and 610 downregulated genes in ddx4-E4Δ ovaries. (B) The heatmap shows the expression pattern of DEGs between WT and ddx4-E4Δ ovaries. (C) Enriched GO terms in all, upregulated, and downregulated DEGs, respectively. (D) GSEA analysis shows the global upregulation of genes involved in reproduction biological process. (E) The expression pattern of upregulated genes in the reproduction biological process term. (F) The expression pattern of downregulated genes in the reproduction biological process term. The purple box indicates the significantly down-regulated meiosis-related gene sycp1.

Acknowledgments
This image is the copyrighted work of the attributed author or publisher, and ZFIN has permission only to display this image to its users. Additional permissions should be obtained from the applicable author or publisher of the image. Full text @ Biology (Basel)