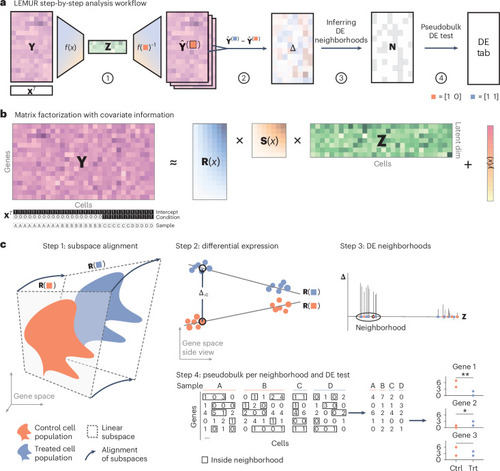
Conceptual overview of LEMUR.

a, Four-step workflow. b, The matrix factorization at the core of LEMUR. c, Details on each step from a: step 1, a linear subspace is fitted separately for each condition. The subspaces for the different conditions are related to each other via affine transformations that are parameterized by the covariates. For this visualization, different two-dimensional subspaces of a three-dimensional gene space are drawn; actual dimensions are higher. Step 2, the differential expression statistic Δ is computed as the difference between the predicted values in the control and treated conditions. The visualization shows a top view of the visualization from step 1. Step 3, for each gene, cells close to each other with consistent Δ values are grouped into neighborhoods. Step 4, a pseudobulk differential expression test is applied to the cells within each neighborhood. Ctrl., control; DE, differentially expressed; dim, dimension; trt, treatment.

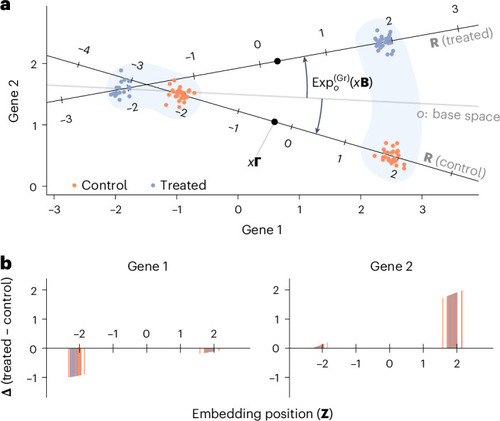
Stylized example with two genes observed in two groups of cells in two conditions.

a, Scatterplot of the gene space with condition-specific one-dimensional subspaces. See the Methods for the mathematical details. b, Predicted differential expression of the two genes in each cell. Gene 1 is less expressed in treatment compared to control only in the ‘left’ cell type; gene 2 is upregulated in the treatment only in the ‘right’ cell type.

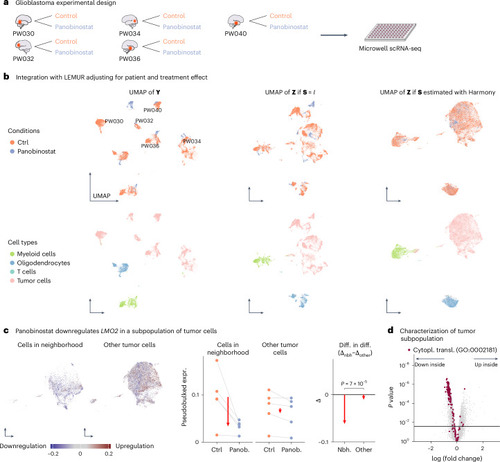
Analysis of five glioblastoma tumor biopsies.

a, Experimental design. b, UMAP of the log-transformed data (first column) and the latent embeddings produced by LEMUR (second and third columns), colored by treatment and cell type (first and second row, respectively). c, Differential expression analysis of LMO2 within tumor cells. Faceted UMAP of cells inside and outside the neighborhood. The scatterplots in the middle show pseudobulked expression values from cells inside and outside the neighborhood by donor and condition. Right, comparison of differences inside and outside the neighborhood (red arrows). The P value is based on a two-sided likelihood ratio test from a negative binomial count model. d, Volcano plot for the comparison between cells inside and outside the subpopulation from f, all in the control condition. Genes annotated as involved with translational activity are highlighted in red. The set of genes above the horizontal line has an FDR of 10%. Nbh., neighborhood; panob., panobinostat; diff. in diff., difference in difference; expr., expression; cytopl. transl., cytoplasmic translation; scRNA-seq, single-cell RNA-seq.

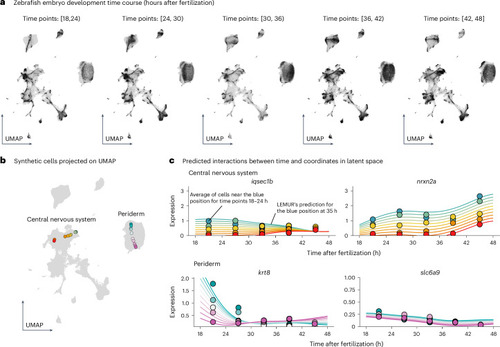
Analysis of a time course single-cell experiment.

a, UMAPs of embryonic development based on the integrated latent space of LEMUR. Black, cells from the respective time window after fertilization; gray, all other cells, for comparison. Because some cell types only exist at particular stages of development, temporal changes in the distribution of black points are to be expected. b, Synthetic cells projected onto the UMAP. They interpolate between pairs of observed cells, one pair in the periderm (purple and turquoise) and one in the central nervous system (red and green). c, Expression predictions (smooth lines) and averaged observed data (points) for four genes as a function of time (x axis) and latent space coordinates (color).

Analysis of a spatial single-cell experiment.

ad, UMAPs of cells from the hippocampi of four mice and spatial maps for two of them, colored by amyloid-β plaque density (calculated from smoothed and normalized fluorescent images26) (a), whether the cell is a neuron (b), LEMUR-predicted differential expression (log2 fold change) for Jun (c) and whether the cell is inside the differential expression neighborhood for Jun (d). e, Scatterplot of Jun expression as a function of plaque density for cells inside the neighborhood, neurons not in the neighborhood and all other cells. The line is a local regression (LOESS) fit through the pseudobulked values. Coord., coordinate.

Acknowledgments
This image is the copyrighted work of the attributed author or publisher, and ZFIN has permission only to display this image to its users. Additional permissions should be obtained from the applicable author or publisher of the image. Full text @ Nat. Genet.