|
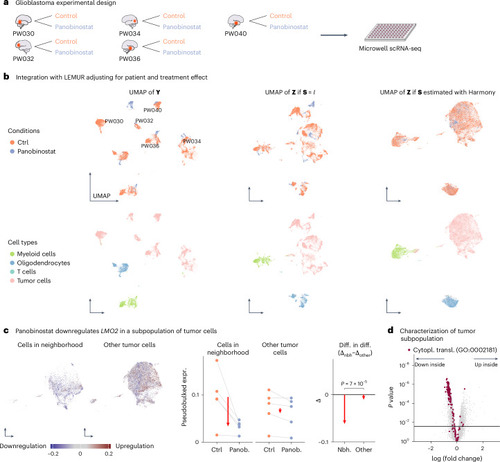
Analysis of five glioblastoma tumor biopsies. a, Experimental design. b, UMAP of the log-transformed data (first column) and the latent embeddings produced by LEMUR (second and third columns), colored by treatment and cell type (first and second row, respectively). c, Differential expression analysis of LMO2 within tumor cells. Faceted UMAP of cells inside and outside the neighborhood. The scatterplots in the middle show pseudobulked expression values from cells inside and outside the neighborhood by donor and condition. Right, comparison of differences inside and outside the neighborhood (red arrows). The P value is based on a two-sided likelihood ratio test from a negative binomial count model. d, Volcano plot for the comparison between cells inside and outside the subpopulation from f, all in the control condition. Genes annotated as involved with translational activity are highlighted in red. The set of genes above the horizontal line has an FDR of 10%. Nbh., neighborhood; panob., panobinostat; diff. in diff., difference in difference; expr., expression; cytopl. transl., cytoplasmic translation; scRNA-seq, single-cell RNA-seq.
|