IMAGE

Fig. 5

ID
ZDB-IMAGE-250318-22
Source
Figures for Ahlmann-Eltze et al., 2025
Image
Figure Caption

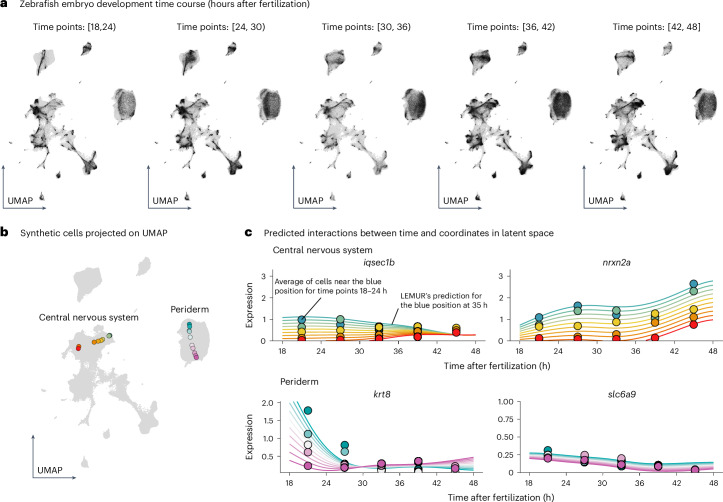
Fig. 5 Analysis of a time course single-cell experiment.

a, UMAPs of embryonic development based on the integrated latent space of LEMUR. Black, cells from the respective time window after fertilization; gray, all other cells, for comparison. Because some cell types only exist at particular stages of development, temporal changes in the distribution of black points are to be expected. b, Synthetic cells projected onto the UMAP. They interpolate between pairs of observed cells, one pair in the periderm (purple and turquoise) and one in the central nervous system (red and green). c, Expression predictions (smooth lines) and averaged observed data (points) for four genes as a function of time (x axis) and latent space coordinates (color).

Acknowledgments
This image is the copyrighted work of the attributed author or publisher, and ZFIN has permission only to display this image to its users. Additional permissions should be obtained from the applicable author or publisher of the image. Full text @ Nat. Genet.