
FIGURE
Fig. 2
- ID
- ZDB-FIG-250318-11
- Publication
- Ahlmann-Eltze et al., 2025 - Analysis of multi-condition single-cell data with latent embedding multivariate regression
- Other Figures
- All Figure Page
- Back to All Figure Page
Fig. 2
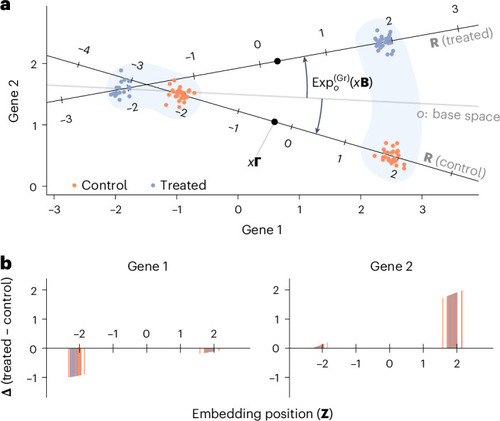
Stylized example with two genes observed in two groups of cells in two conditions. |
Expression Data
Expression Detail
Antibody Labeling
Phenotype Data
Phenotype Detail
Acknowledgments
This image is the copyrighted work of the attributed author or publisher, and
ZFIN has permission only to display this image to its users.
Additional permissions should be obtained from the applicable author or publisher of the image.
Full text @ Nat. Genet.