FIGURE

Fig. 1

ID
ZDB-FIG-250318-17
Publication
Ahlmann-Eltze et al., 2025 - Analysis of multi-condition single-cell data with latent embedding multivariate regression
Other Figures
All Figure Page
Back to All Figure Page
Fig. 1

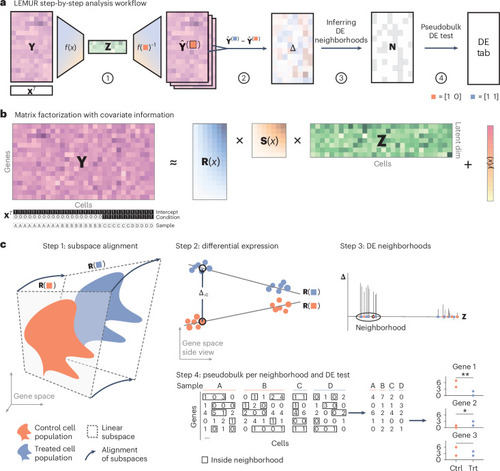
Conceptual overview of LEMUR.

a, Four-step workflow. b, The matrix factorization at the core of LEMUR. c, Details on each step from a: step 1, a linear subspace is fitted separately for each condition. The subspaces for the different conditions are related to each other via affine transformations that are parameterized by the covariates. For this visualization, different two-dimensional subspaces of a three-dimensional gene space are drawn; actual dimensions are higher. Step 2, the differential expression statistic Δ is computed as the difference between the predicted values in the control and treated conditions. The visualization shows a top view of the visualization from step 1. Step 3, for each gene, cells close to each other with consistent Δ values are grouped into neighborhoods. Step 4, a pseudobulk differential expression test is applied to the cells within each neighborhood. Ctrl., control; DE, differentially expressed; dim, dimension; trt, treatment.

Expression Data

Expression Detail
Antibody Labeling
Phenotype Data

Phenotype Detail
Acknowledgments
This image is the copyrighted work of the attributed author or publisher, and ZFIN has permission only to display this image to its users. Additional permissions should be obtained from the applicable author or publisher of the image. Full text @ Nat. Genet.