
- Title
-
Integrated transcriptomic analysis reveals evolutionary and developmental characteristics of tendon ossification in teleost
- Authors
- Wang, X.D., Shi, F.L., Zhou, J.J., Xiao, Z.Y., Tu, T., Xiong, X.M., Nie, C.H., Wan, S.M., Gao, Z.X.
- Source
- Full text @ BMC Biol.
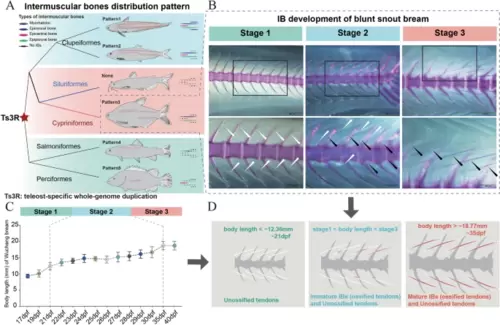
The developmental and evolutionary characteristics of IBs (tendon ossification in myosepta). A IB distribution patterns in teleosts. Pattern 1 (Clupeiformes, Japanese grenadier anchovy (Coilia nasus)), epineural bones (ENBs), epipleural bones (EPBs), epicentral bones (ECBs), and myorhabdois (MBs); pattern 2 (Clupeiformes, Atlantic herring (Clupea harengus)), ENBs, EPBs, ECBs; pattern 3 (Cypriniformes, blunt snout bream (M. amblycephala)): ENBs and EPBs; none (Siluriformes, channel catfish (Ictalurus punctatus)), no IBs; pattern 4 (Salmoniformes, rainbow trout (Oncorhynchus mykiss)): ENBs; pattern 5 (Perciformes, Mandarin fish (Siniperca chuatsi)): ECBs. B–D Three developmental stages of IBs in blunt snout bream. B Histological analysis of IB development. White arrows marker tendons in myosepta; black arrows marker ossified tendons (IBs) in myosepta. C The relationship between IB development and body length. D Stage 1: only unossified tendon distribution without IB development (body length < ~ 12.36 mm); stage 2: distribution of both immature IBs (ossified tendons) and unossified tendons (body length ~ 12.36– ~ 18.77 mm); stage 3: distribution of mature IBs (ossified tendons) (body length > 18.77 mm) |

Gene recruitment and cellular origin of ENB and EPB in blunt snout bream. A Genes recruited to ENBs mainly originated from epipleural bones (EPBs), neural spines, operculum, suboperculum, and vertebra. The expression levels of ENB-specific expression genes were depicted in heatmap. B Genes recruited to EPBs mainly originated from epineural bones (ENBs), skin, rib, operculum, and neural spines. The expression levels of EPB-specific expression genes were depicted in heatmap. C Gene Ontology (GO) analysis of the intersection of ENB-specific expression genes and EPB-specific expression genes. D Temporal expression and GO analysis of genes influenced by Ts3R |
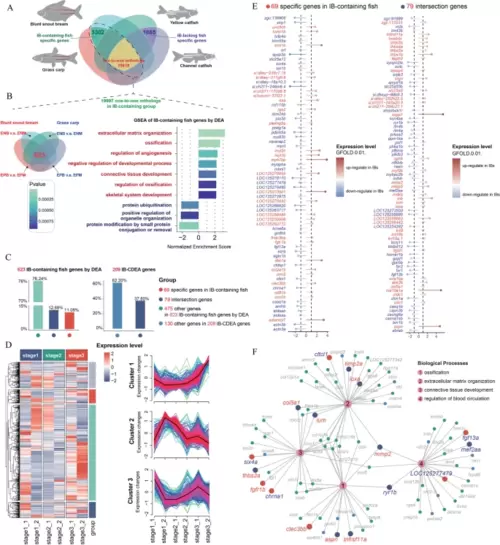
Comparative transcriptomic analysis for identifying key genes involved in IB development. A Identification of one-to-one orthologous gene pairs across different species. A total of 19,997 one-to-one orthologous gene pairs were identified in the IB-containing group, and 15,818 one-to-one orthologous gene pairs were identified in the IB-containing vs. IB-lacking fish group. A total of 3302 genes were specific to the IB-containing fish group. B Identification of 623 IB-related differentially expressed genes in the IB-containing fish group. Gene set enrichment analysis was performed on this gene set. C Grouping of differentially expressed genes identified from the IB-containing fish group (left plot) and the IB-containing vs. IB-lacking fish group (right plot). D Expression patterns of genes from different groups in C during IB development. E Lollipop plot displaying IB-containing-fish specific differentially expressed genes and orthologous differentially expressed genes. F Functional network plot of selected differentially expressed genes |
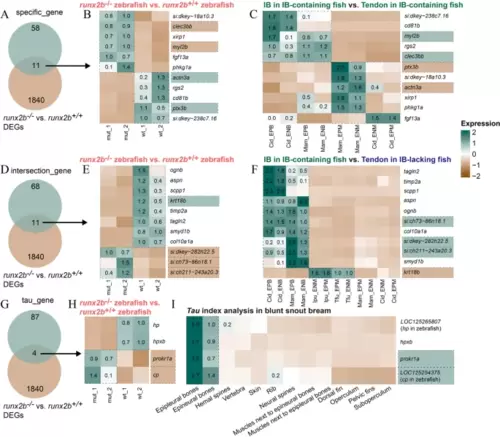
Comparative analysis of gene expression patterns in runx2b+/+ and runx2b−/− zebrafish. A–C Intersection genes between 69 specific genes in IB-containing fish (Fig. 3E left) and genome editing zebrafish DEGs (differential expressed genes). Expression patterns of intersecting genes in different groups. D–F Intersection genes between 79 differentially expressed genes conserved across species (Fig. 3E right) and genome editing zebrafish DEGs. Expression patterns of intersecting genes in different groups. G–I Intersection genes between 91 IB-specific expression genes by tau and genome editing zebrafish DEGs. Expression patterns of intersecting genes in different groups. Cid, grass carp; Mam, blunt snout bream; Ipu, channel catfish; Tfu, yellow catfish |

The cellular differentiation process of tendon ossification in runx2b+/+ (with IBs) and runx2b−/− (without IBs) zebrafish. A Reclustering of superclusters associated with tendon ossification in runx2b+/+ and runx2b−/− zebrafish. B Proportional analysis and marker gene annotation of the 10 sub-clusters. C RNA velocity analysis of 10 sub-clusters in runx2b+/+ zebrafish. D RNA velocity analysis of 10 sub-clusters in runx2b−/− zebrafish. E Violin plots of candidate genes in Fig. 4 |
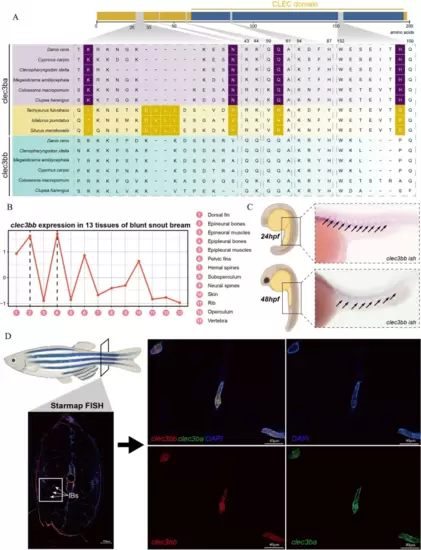
IB-specific genetic changes and gene expression features in tetranectin gene family. A Amino acid changes in CLEC3BA and CLEC3BB across IB-containing fishes (Clupea harengus, Danio rerio, Megalobrama amblycephala, Ctenopharyngodon idella) and IB-lacking fishes (Silurus meridionalis, Ictalurus punctatus, Tachysurus fulvidraco). B clec3bb expression in 13 tissues of blunt snout bream. C The expression pattern of clec3bb gene in 24 hpf (hours post fertilization) and 48 hpf zebrafish embryos. D The expression pattern of clec3bb gene in 60 dpf zebrafish by STARmap FISH EXPRESSION / LABELING:
|
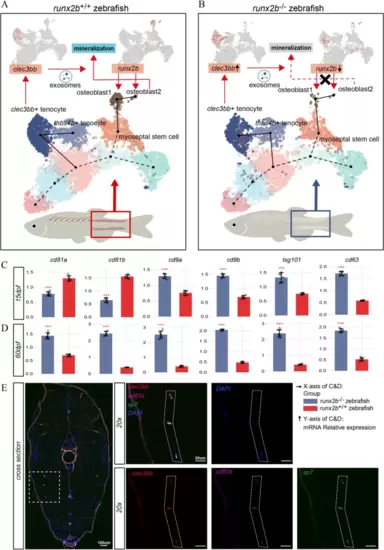
Graphic summary of the role of clec3bb in tendon ossification. A We discovered that myoseptal stem cell could differentiate into osteoblasts in wild type zebrafish by Slingshot analysis. Osteoblast2 further mineralized and formed IBs. Myoseptal stem cell could also differentiate into clec3bb + tenocyte, ultimately forming thbs4b + tenocyte. clec3bb showed specific expression in clec3bb + tenocytes. B After runx2b deficiency, the process of myoseptal stem cell differentiating into osteoblasts was inhibited. The process of differentiation from myoseptal stem cell to clec3bb + tenocytes undergone alterations. clec3bb expression level was increased in clec3bb + tenocytes of runx2b−/− zebrafish. C mRNA relative expression of biomarkers of exosome (cd81a, cd81b, cd9a, cd9b, tsg101, and cd63) in 15 dpf (stage without IBs/tendon ossification in wild type zebrafish) of runx2b−/− zebrafish and runx2b+/+ zebrafish and in 60 dpf (stage with IBs/tendon ossification in wild type zebrafish). D Comparison of gene expression between runx2b−/− and runx2b+/+ zebrafish (t-test, two-sided, *** (p value < 0.001)). Error bars represent mean ± SD. E The expression patterns of sp7, cd81b, and clec3bb gene in 60 dpf zebrafish by STARmap FISH EXPRESSION / LABELING:
PHENOTYPE:
|