
- Title
-
Versican controlled by Lmx1b regulates hyaluronate density and hydration for semicircular canal morphogenesis
- Authors
- Mori, Y., Smith, S., Wang, J., Eliora, N., Heikes, K.L., Munjal, A.
- Source
- Full text @ Development

Genes encoding the transcription factor Lmx1b, lmx1ba and lmx1bb, are differentially patterned and necessary for semicircular canal morphogenesis. (A) Illustrations show typical morphological features of OVs at relevant stages of semicircular canal morphogenesis. Images are maximum intensity projections of OVs at select time points stained with multiplex in situ probes against lmx1bb (green), lmx1ba (magenta), and col2a1a (white). The z-volume and the contrast of each time point are individually set to capture all buds and achieve better visualization. Yellow lines indicate buds or pillars. Scale bar: 50 μm. (B) Maximum intensity projections of OVs of membrane-NeonGreen-expressing embryos at 50 hpf injected with control or jag1b MO stained with multiplex in situ probes against lmx1bb (green) and lmx1ba (magenta). The z-volume of each condition is individually set to capture all buds and show the OV morphology. Heatmaps represent fluorescence intensity with the same contrast for each probe of embryos injected with control and jag1b MO. Crista and macula are marked by yellow and black asterisks, respectively. Scale bar: 50 μm. (C) 3D-rendered OVs at 50 or 72 hpf from membrane-NeonGreen-expressing embryos injected with control or jag1b MO. Scale bars: 50 μm. (D) Illustrations showing the difference in gene expression of lmx1ba and lmx1bb at 50 hpf (left) or semicircular canal morphology at 72 hpf (right) between embryos injected with control and jag1b MO. (E) 3D-rendered OVs at 50 or 72 hpf from membrane-mCherry-expressing embryos injected with tyrosinase or lmx1b double gRNA. Scale bars: 50 μm. (F,F′) Quantification of bud length (F) and lateral bud width (F′) at 50 hpf in embryos injected with tyrosinase or lmx1b double gRNA. Data are mean±s.e.m. In the absence of buds, bud lengths correspond to cell lengths. n denotes the number of buds from individual embryos measured per condition from two independent experiments. P-values as labeled (unpaired, two-tailed Student's t-test). a, anterior; al, anterior-lateral; hc, hair cells; p, posterior; pl, posterior-lateral; v, ventral. Representative images and data from two independent experiments are shown. EXPRESSION / LABELING:
PHENOTYPE:
|

Lmx1ba and lmx1bb regulate HA and Versican synthesis genes for morphogenesis. (A) The workflow illustrates screening and validation of F0 gRNA/Cas9-injected embryos, followed by a multiplex in situ hybridization experiment. gRNA/Cas9-injected embryos were screened at 50 hpf using their inner ear morphology. A small piece from the tail was clipped to assess genome editing using a T7 endonuclease assay. The remaining embryo body was fixed with PFA. Individually validated embryos from controls and lm1ba and lmx1bb knockdown were pooled in a single tube to perform HCR-FISH. dpf, days post-fertilization; SCC, semicircular canal. Created in BioRender. Munjal, A. (2024) https://BioRender.com/y43g100. (B-I) Effect of lmx1b double knockdown on ECM-associated gene expression in OV. Maximum intensity projections of OVs and quantification of probe fluorescence intensity of has3 (B,C), vcana (D,E), vcanb (F,G), and chsy1 (H,I) probes. col2a1a probe and the other ECM-associated gene probes are shown as white and green, respectively. The z-volume of each condition is individually set to capture all buds and show the OV morphology. Heatmaps represent fluorescence intensity with the same contrast for each probe of embryos injected with tyrosinase or lmx1b double gRNA. Representative images from two independent experiments are shown. Scale bar: 50 μm. Data are mean±s.e.m. n denotes the number of buds from individual embryos measured per condition from two independent experiments. P-values as labeled (unpaired, two-tailed Student's t-test). |

Versican, a CS proteoglycan, is required for semicircular canal morphogenesis. (A,C) 3D-rendered OVs at 50 or 72 hpf from membrane-NeonGreen-expressing embryos injected with tyrosinase (left) or versican double (right) gRNA (A), and control (left) or versican double MO (right) (C). Scale bars: 50 μm. (B,D) Quantification of bud length at 50 hpf in embryos injected with tyrosinase or versican double gRNA (B), and control or versican double MO (D). Data are mean±s.e.m. In the absence of buds, bud lengths correspond to cell lengths. n denotes the number of buds from individual embryos measured from two independent experiments. P-values as labeled (unpaired, two-tailed Student's t-test). (E) Target sites for sgRNAs at the vcana or vcanb locus used to generate stable versican double-knockout mutants. (F) Brightfield images of sibling control and versican double-knockout mutant embryos at 72 hpf obtained from vcana−/+; vcanb−/−parents. The arrow indicates epicardial edema in the versican double-knockout mutant embryo. The dashed lines in the magnified images indicate the outlines of pillars or buds in the OV. Scale bars: 50 (right-hand panels); 500 μm (left-hand panels). (G) 3D-rendered OVs at 50 hpf from membrane-NeonGreen-mRNA injected embryos of sibling control (left) or versican double-knockout mutant (right). Representative images from two independent experiments are shown. Scale bar: 50 μm. (H) Quantification of bud length in embryos of sibling control or versican double knockout at 50 hpf. Data are mean±s.e.m. In the absence of buds, bud lengths correspond to cell lengths. n denotes the number of buds from individual embryos measured from two independent experiments. P-values as labeled (unpaired, two-tailed Student's t-test). a/A, anterior; al/AL; anterior-lateral; l, lateral; p/P, posterior; pl/PL, posterior-lateral; v, ventral. Representative images from two independent experiments are shown. EXPRESSION / LABELING:
PHENOTYPE:
|

Versican regulates density of the bud-ECM via accumulation of HA. (A,B) 3D-rendered OVs showing hyaluronic acid (HA), chondroitin sulfate (CS), and F-actin using HA-binding protein (HABP), anti-chondroitin sulfate antibody, and phalloidin, respectively, at 50 hpf in embryos injected with tyrosinase or versican double gRNA. Inset shows 2D section of the antero-lateral bud. Scale bar: 50 μm. (B) Quantification of fluorescence intensity of HABP in embryos injected with tyrosinase or versican double gRNA. Maximum intensity projection images (20 μm-thickness) of HABP in the lateral bud region were used for the quantification. Data are mean±s.e.m. n denotes the number of embryos measured from two independent experiments. P-values as labeled (unpaired, two-tailed Student's t-test). (C) Illustration showing the different sizes of dextran injected into the periotic region percolating into the bud-ECM region in control and vcana knockdown conditions. (D) Composite of 2D sections of OVs showing percolation of dextran from periotic region into the bud-ECM region at 2 h post-injection (hpi). Different sizes of Texas-Red dextran, 3 kDa, 10 kDa, or 70 kDa (magenta), with approximate Stokes radii 1, 2, or 5 nm, respectively, were co-injected with aBt (green) in membrane-NeonGreen (blue)-expressing control or vcana MO-injected embryos. aBt colocalizes with all three dextran sizes in the periotic region (white). Contrast is the same across embryos. Scale bar: 50 μm. (E) Quantification of fluorescence intensities of different sizes of dextran in the bud-ECM region normalized to their intensities in the periotic space. Data are mean±s.e.m. n denotes the number of embryos measured from two independent experiments. P-values as labeled (one-way ANOVA with Tukey's test). Representative images from two independent experiments are shown. |
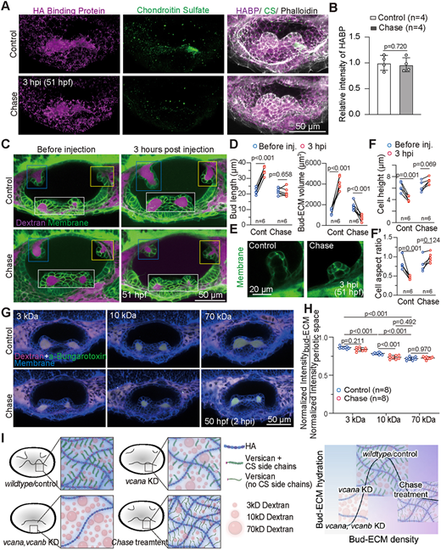
Chondroitin sulfate is required for the hydration of Versican-hyaluronate ECM. (A) 3D-rendered OVs showing hyaluronic acid (HA), chondroitin sulfate (CS), and F-actin using HA-binding protein (HABP), anti-chondroitin sulfate antibody, and phalloidin, respectively, in embryos injected with control buffer or chase (10 U/ml), stained at 3 hpi. Scale bar: 50 μm. (B) Quantification of fluorescence intensity of HABP in embryos injected with control buffer or chondroitinase (Chase) at 3 h post-injection (hpi). Maximum intensity projection images (20 μm-thickness) of HABP in the lateral bud region were used for the quantification. Data are mean±s.e.m. n denotes the number of embryos measured from two independent experiments. P-value as labeled (paired, two-tailed Student's t-test). (C) Composites of 2D sections from membrane-NeonGreen-expressing embryos before injection or at 3 hpi of control buffer or Chase. Pre-injection and post-injection images were acquired from the same embryo. The bud-ECM region is labeled with 3 kDa Texas-Red Dextran. Anterior, posterior, and lateral buds from different z-depths are framed in blue, yellow, and white boxes, respectively. Scale bar: 50 μm. (D) Quantification of bud length (left), bud-ECM volume (right) of the anterior bud in embryos before injection or at 3 hpi of control buffer or Chase. Bud-ECM volume was measured using the bud-ECM region labeled by Texas-Red Dextran. n denotes the number of embryos measured from two independent experiments. P-values as labeled (paired, two-tailed Student's t-test). (E) Representative 2D sections of anterior bud in membrane-NeonGreen-expressing embryos injected with control buffer or chase at 3 hpi. (F) Quantification of cell height (F) and cell aspect ratio (height/width) (F′) of the anterior bud in the membrane-NeonGreen-expressing embryos before injection or at 3 hpi of control buffer or chase. n denotes the number of embryos measured from two independent experiments. P-values as labeled (unpaired, two-tailed Student's t-test). (G) Composite of 2D sections of OVs showing percolation of dextran from periotic region into bud-ECM region at 2 hpi. Control buffer or Chase was co-injected with Texas-Red dextran (magenta; 3, 10, or 70 kDa) and aBt (green) in embryos expressing membrane-NeonGreen (blue). aBt colocalizes with all three dextran sizes in the periotic region (white). Contrast is the same across embryos. Experiments with 10 kDa dextran were performed on different days than experiments with 3 kDa and 70 kDa dextrans. Scale bar: 50 μm. (H) Quantification of fluorescence intensities of different sizes of dextran in the bud-ECM region normalized to their intensities in the periotic space. Data are mean±s.e.m. n denotes the number of embryos measured from two independent experiments. P-values as labeled (one-way ANOVA with Tukey's test). (I) A schematic model illustrating the three classes of bud-ECM behaviors regulated by Versican and its CS side chains: In vcana and vcanb knockdown (KD) conditions, reduced HA and CS accumulation lead to decreased bud-ECM volume; selective inhibition of CS [Chondroitinase (Chase) treatment] results in unaffected HA levels but increased ECM density and reduced ECM hydration and volume; and an intermediate regime, where Versican facilitates both HA and CS accumulation, promotes intermediate ECM density, significant hydration, and bud extension. Created in BioRender. Munjal, A. (2024) https://BioRender.com/d61d142. Representative images from two independent experiments are shown. |