
- Title
-
Homozygous slc25a20 zebrafish mutant reveals insights into carnitine-acylcarnitine translocase deficiency pathogenesis
- Authors
- Hishida, R., Ishiguro, K., Yamanaka, T., Toyokuni, S., Matsui, H.
- Source
- Full text @ Mol Genet Metab Rep
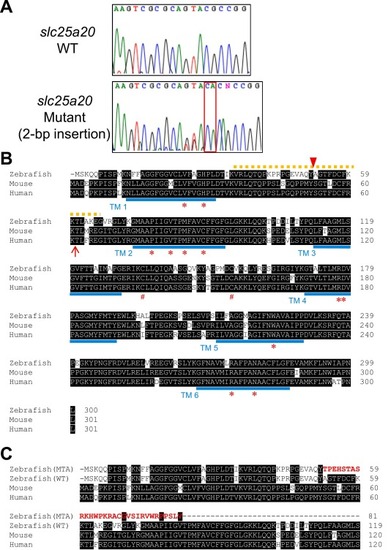
Generation of slc25a20 mutant zebrafish. (A) Sequences of wild-type (WT) and slc25a20 mutant fish are shown. The red square indicates the insertion with a 2-base pair addition. The N (G or A) after the insertion site represents a genetic polymorphism. (B) Protein sequence of zebrafish Slc25a20. Comparison of the amino acid sequence of SLC25A20 among D. rerio, M. musculus, and humans. Sequence alignment was conducted using Clustal Omega (https://www.ebi.ac.uk/jdispatcher/msa/clustalo) [58]. Shaded residues indicate conserved amino acids. The red arrowhead indicates the position of the insertion mutation in D. rerio, isolated in this study. The orange dotted line indicates the site encoded by exon 2 in zebrafish. Blue bars indicate the positions of the 6 presumed transmembrane domains [5]. Red asterisks and sharps indicate the amino acid residues involved in binding substrate molecules and in cell redox sensing and control, respectively [7,22]. The red arrow indicates the position of the frameshift mutation (p.Lys61fs) found in a severely ill patient [27,35]. (C) Protein sequence of zebrafish Slc25a20 (MTA) and its comparison of the amino acid sequence. The red bold characters indicate the unrelated 30-amino acid sequence after the frameshift. |
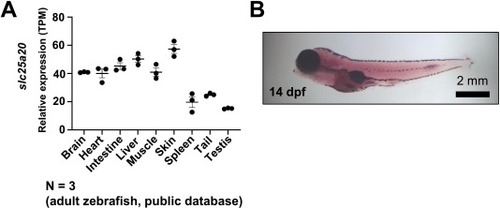
Transcript expression profile of the slc25a20 gene. (A) RNA sequence analysis reveals the ubiquitous expression of the gene in adult fish (data obtained from the public database, https://www.ncbi.nlm.nih.gov/geo/query/acc.cgi?acc=GSE171906). The relative expression levels of each organ are compared on TPM (transcripts per million) basis. (B) In situ hybridization of slc25a20 mRNA demonstrates its ubiquitous expression in 14-day-old fry. EXPRESSION / LABELING:
|
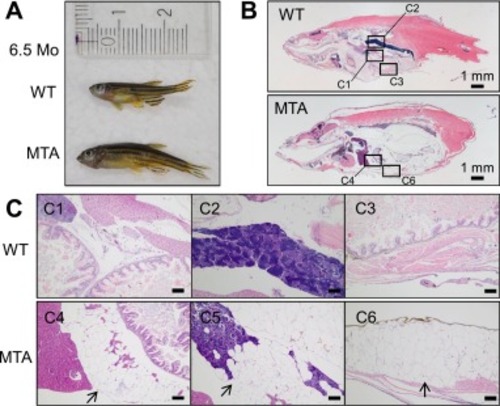
Adipose tissue accumulation inside and outside the coelomic cavity of the slc25a20 mutant. (A) Appearance of zebrafish used for tissue analysis. (B) Representative hematoxylin and eosin (HE) staining of 3-μm paraffin sections from the individuals showing a cross-section of the whole body. Squares correspond to the magnified regions shown in the following images. (C) Marked accumulation of adipose tissue in the mutant (C4–6) compared to the wild-type fish (C1–3). The images between the liver and the intestine (C1, C4), near the testes (C2, C4), and just outside of the coelomic cavity (C3, C6) are shown. Image C5 was taken from a different section than the one in B. The back arrows indicate abnormal accumulation of adipose tissue. Scale bar, 100 μm. PHENOTYPE:
|
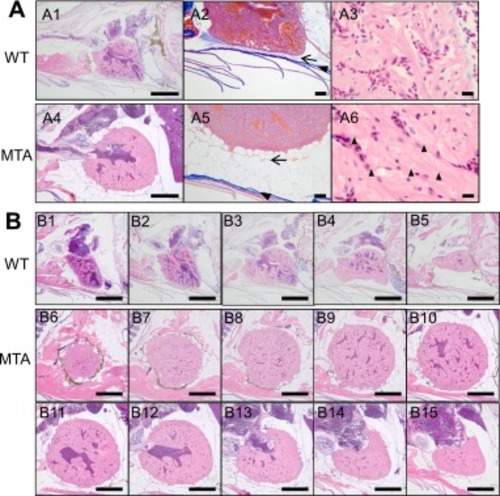
Hypertrophy and abnormal histology observed in the heart of the slc25a20 mutant. (A) Representative cardiac images of the wild-type fish (A1–3) and the mutant (A4–6). (A1, A4) Low-magnification images of the hearts from hematoxylin and eosin (HE)-stained paraffin sections. Scale bars, 0.5 mm. (A2, A5) Images of azan-stained paraffin sections adjacent to those in A1 and A4. Arrowhead and arrow indicate the connective tissue layer just inside the ventral skin and the coelomic membrane, respectively. Scale bars, 100 μm. (A3, A6) High-magnification images of the ventricles from HE-stained paraffin sections. The back arrowheads indicate eosin-negative membranes surrounding eosin-positive nuclei. Scale bars, 10 μm. (B) Cardiac images of serial HE-stained sections of the wild-type fish (B1–5) and the mutant (B6–15). The positions of the A1 and A4 sections are between the B2 and B3 sections and between the B12 and B13 sections, respectively. The distance between the sections is approximately 30 μm. Scale bar, 0.5 mm. PHENOTYPE:
|
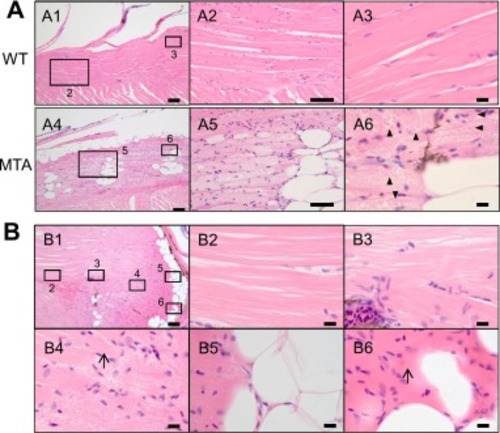
Adipose accumulation and degeneration observed in the skeletal muscle of the slc25a20 mutant. (A) Representative images of the skeletal muscle from hematoxylin and eosin (HE)-stained paraffin sections of the wild-type fish (A1–3) and the mutant (A4–6). (A1, A4) Low-magnification images of the skeletal muscles in the dorsal trunk. Squares correspond to the magnified regions shown in the following images. Scale bars, 100 μm. (A2, A5) Magnified images. Scale bars, 50 μm. (A3, A6) High-magnification images. The back arrowheads indicate eosin-negative membranes surrounding eosin-positive nuclei. Scale bars, 10 μm. (B) Representative images of the skeletal muscle in the tail region near the trunk from the HE-stained paraffin section of the mutant (the same section as in Fig. 3B). The body surface of the tail was sloped, so in the cut surface of this section, the tissue is closer to the skin from the left side to the right side. (B1) Low-magnification image. Squares correspond to the magnified regions shown in the following images. Scale bars, 100 μm. (B2–6) High-magnification images. Arrows indicate the faint traces of sarcomere structure. Scale bars, 10 μm. PHENOTYPE:
|
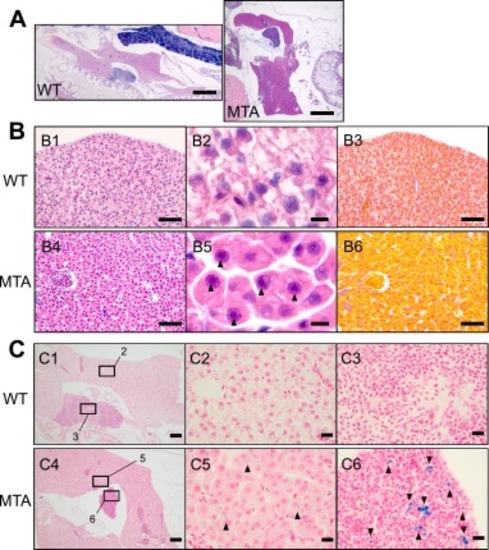
Abnormal appearance of hepatocytes and iron depositions in the liver and spleen of the slc25a20 mutant. (A) Representative images of the whole liver from hematoxylin and eosin (HE)-stained paraffin sections of the individuals. Scale bar, 0.5 mm. (B) Representative images of liver tissues from the wild-type fish (B1–3) and the mutant (B4–6). (B1, B4) Low-magnification images of the livers from HE-stained paraffin sections. Scale bars, 50 μm. (B2, B5) High-magnification images of hepatocytes. The back arrowheads indicate prominent nucleoli. Scale bars, 5 μm. (B3, B6) Images of azan-stained paraffin sections adjacent to those in B1 and B4. (C) Representative images of the liver and spleen from Prussian blue-stained paraffin sections of the wild-type fish (C1–3) and the mutant (C4–6). (C1, C4) Low-magnification images. Squares correspond to the magnified regions shown in the following images. Scale bars, 100 μm. (C2, C5) High-magnification images of the livers. Scale bars, 10 μm. (C3, C6) High-magnification images of the spleens. The back arrowheads indicate focal trace iron depositions. Scale bars, 10 μm. PHENOTYPE:
|