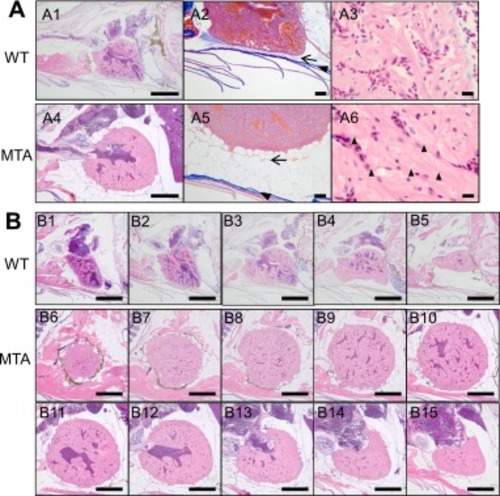
Hypertrophy and abnormal histology observed in the heart of the slc25a20 mutant. (A) Representative cardiac images of the wild-type fish (A1–3) and the mutant (A4–6). (A1, A4) Low-magnification images of the hearts from hematoxylin and eosin (HE)-stained paraffin sections. Scale bars, 0.5 mm. (A2, A5) Images of azan-stained paraffin sections adjacent to those in A1 and A4. Arrowhead and arrow indicate the connective tissue layer just inside the ventral skin and the coelomic membrane, respectively. Scale bars, 100 μm. (A3, A6) High-magnification images of the ventricles from HE-stained paraffin sections. The back arrowheads indicate eosin-negative membranes surrounding eosin-positive nuclei. Scale bars, 10 μm. (B) Cardiac images of serial HE-stained sections of the wild-type fish (B1–5) and the mutant (B6–15). The positions of the A1 and A4 sections are between the B2 and B3 sections and between the B12 and B13 sections, respectively. The distance between the sections is approximately 30 μm. Scale bar, 0.5 mm.
|
