
- Title
-
Sex Difference in Histopathological and Steroidogenesis Metabolism of Zebrafish After Exposure to Spiromesifen
- Authors
- Zhang, J., Yang, Y., Fan, Y., Yu, W., Qian, L., Duan, M., Zhao, W., Chen, X., Song, W., Li, X., Wang, C.
- Source
- Full text @ Env. Tox.
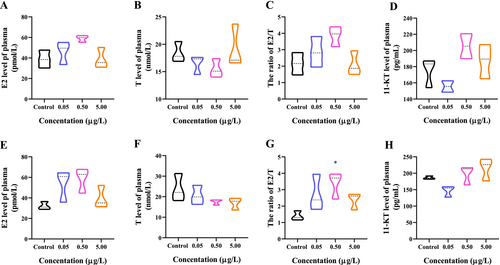
Effect of SPM on plasma sex steroid level in zebrafish after 21 days exposure. (A) Plasma sex steroid level of E2 in female zebrafish; (B) Plasma sex steroid level of T in female zebrafish; (C) E2/T ratio in female zebrafish; (D) Plasma sex steroid level of 11-KT in female zebrafish; (E) Plasma sex steroid level of E2 in male zebrafish; (F) Plasma sex steroid level of T in male zebrafish; (G) E2/T ratio in male zebrafish; (H) Plasma sex steroid level of 11-KT in male zebrafish. Results are presented as mean ± SEM of three replicate samples. determined by Tukey's multiple comparison tests, *p < 0.05 indicate significant differences between the exposure and control groups. Error bars indicate standard deviation. |

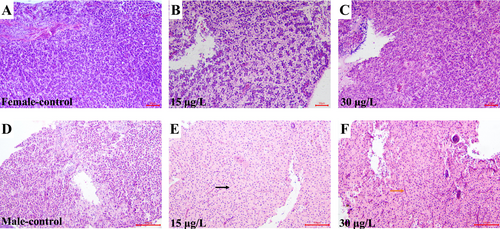
Histology observation in the ovaries of female zebrafish after 21 days of exposure to SPM. (A) Control female ovary (20×); (B) After exposed to 15 μg/L of SPM (20×); (C) After exposed to 30 μg/L of SPM, the edges of the follicles are irregular and the nucleus breaks or disappears after exposed to 30 μg/L of SPM (20×). The oocytes in the ovaries included perinucleolar oocyte (PO), early cortical alveolar oocyte (ECAO), cortical alveolar oocyte (CAO), early vitellogenic oocyte (EV) and mature oocyte (MO); (D) Control male testes (20×); (E) Interstitial connective tissue hyperplasia after exposed to 15 μg/L of SPM (20×); (F) Interstitial connective tissue widener after exposed to 30 μg/L of SPM (20×). Arrows mark the lesion region. The spermatocytes in the testes including spermatocyte (SPC) and spermatozoa (SZ). |
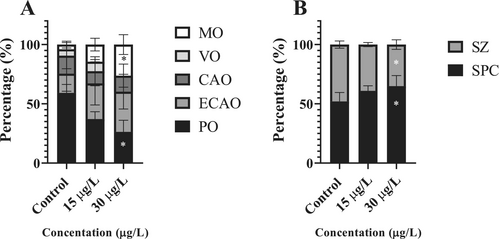
The percentage (%) of different stages of oocytes in females and spermatogenic cells in males. (A) Relative percentages of different stages of oocytes in female zebrafish; (B) Relative percentages of different stages of testes in male zebrafish. |
Histology observation in the female zebrafish liver after 21 days of exposure to SPM. (A) Control of female zebrafish liver (20×); (B) Liver steatosis and nuclear dissolution in female zebrafish liver after exposed to 15 μg/L of SPM (20×); (C) Female zebrafish liver inflammation and extensive necrosis after exposed to 30 μg/L of SPM (20×); (D) Control of male zebrafish liver (20×); (E) Swelling of liver cells in male fish after exposed to 15 μg/L of SPM (20×); (F) Swelling and congestion of liver cells in male zebrafish after exposed to 30 μg/L of SPM (20×). |
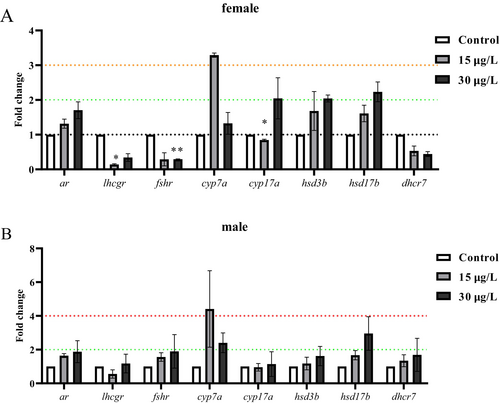
Gene expression analysis. (A) Effect of SPM on the transcription of genes in the female livers; (B) Effect of SPM on the transcription of genes in the male livers. Values represent mean ± SD (n = 3), determined by Tukey's multiple comparison tests, *p < 0.05 and **p < 0.01, indicate significant differences between the exposure and the corresponding control groups. Error bars indicate standard deviation. |
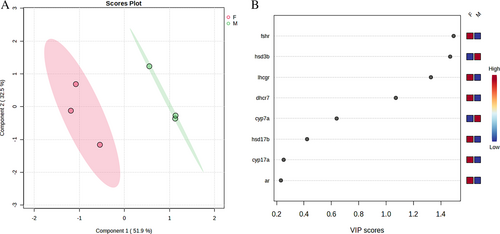
Schematic representation of 2D PLS-DA scores plot and important features. (A) Gene expression features and concentrations from female and male (n = 3 per group per analysis) were normalized and assessed by partial least squares–discriminant analysis (PLSDA), 2D score plots were produced to separate feature differences between female and male zebrafish. (B) Variable importance of projection (VIP) scores indicate the most important features separating female and males after SPM exposure. |