
|
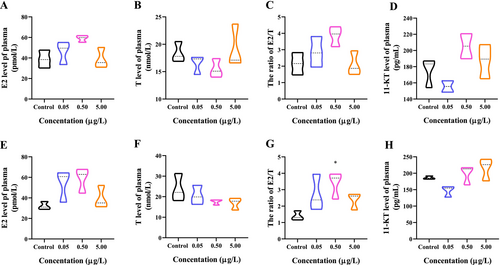
Fig. 1 Effect of SPM on plasma sex steroid level in zebrafish after 21 days exposure. (A) Plasma sex steroid level of E2 in female zebrafish; (B) Plasma sex steroid level of T in female zebrafish; (C) E2/T ratio in female zebrafish; (D) Plasma sex steroid level of 11-KT in female zebrafish; (E) Plasma sex steroid level of E2 in male zebrafish; (F) Plasma sex steroid level of T in male zebrafish; (G) E2/T ratio in male zebrafish; (H) Plasma sex steroid level of 11-KT in male zebrafish. Results are presented as mean ± SEM of three replicate samples. determined by Tukey's multiple comparison tests, *p < 0.05 indicate significant differences between the exposure and control groups. Error bars indicate standard deviation.