
FIGURE
Fig. 6
- ID
- ZDB-FIG-250417-6
- Publication
- Zhang et al., 2024 - Sex Difference in Histopathological and Steroidogenesis Metabolism of Zebrafish After Exposure to Spiromesifen
- Other Figures
- All Figure Page
- Back to All Figure Page
Fig. 6
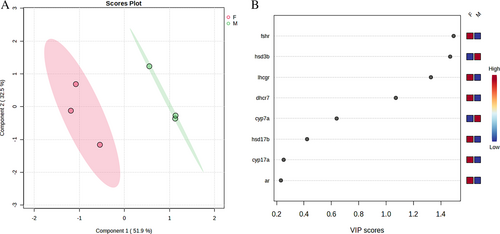
Schematic representation of 2D PLS-DA scores plot and important features. (A) Gene expression features and concentrations from female and male (n = 3 per group per analysis) were normalized and assessed by partial least squares–discriminant analysis (PLSDA), 2D score plots were produced to separate feature differences between female and male zebrafish. (B) Variable importance of projection (VIP) scores indicate the most important features separating female and males after SPM exposure. |
Expression Data
Expression Detail
Antibody Labeling
Phenotype Data
Phenotype Detail
Acknowledgments
This image is the copyrighted work of the attributed author or publisher, and
ZFIN has permission only to display this image to its users.
Additional permissions should be obtained from the applicable author or publisher of the image.
Full text @ Env. Tox.