
Image
|
Figure Caption
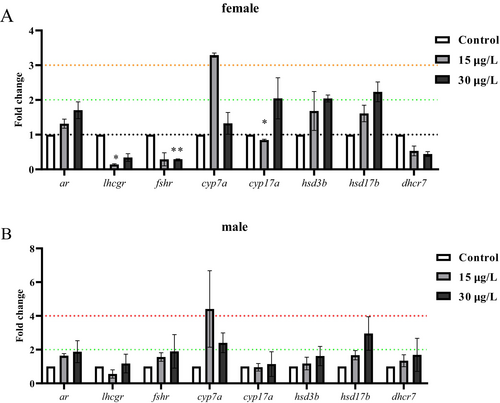
Fig. 5 Gene expression analysis. (A) Effect of SPM on the transcription of genes in the female livers; (B) Effect of SPM on the transcription of genes in the male livers. Values represent mean ± SD (n = 3), determined by Tukey's multiple comparison tests, *p < 0.05 and **p < 0.01, indicate significant differences between the exposure and the corresponding control groups. Error bars indicate standard deviation.
Acknowledgments
This image is the copyrighted work of the attributed author or publisher, and
ZFIN has permission only to display this image to its users.
Additional permissions should be obtained from the applicable author or publisher of the image.
Full text @ Env. Tox.