FIGURE SUMMARY
Title

Integrated Studies on Male Reproductive Toxicity of Decabromodiphenyl Ethane in Zebrafish Spermatozoa Ex Vivo, Male Zebrafish in Vivo, and GC-1 Cells in Vitro

Authors
Yang, L., Zhang, Y., Hua, J., Song, G., Li, F., Zheng, N., Zhang, T., Xu, Z., Ren, X., Zhu, B., Han, Y., Guo, Y., Han, J., Zhou, B.
Source
Full text @ Environ. Health Perspect.

Effects of DBDPE ex vivo exposure on zebrafish spermatozoa motility and development of offspring obtained by artificial fertilization. (A) Schematic diagram for ex vivo exposure of zebrafish spermatozoa and artificial fertilization. (B) Total motility (TM) of zebrafish spermatozoa. (C) Progressive motility (PM) of zebrafish spermatozoa. (D) Linearity of zebrafish spermatozoa. Each dot in (A–D) represents one replicate data point (mean value of each test sample). The dot numbers represent the data size (n=3041/group) for statistical analysis. (E) Fertilization rate of zebrafish embryos derived by artificial fertilization using unexposed eggs and DBDPE-exposed sperm (n=6/group). (F) Survival rate determined at 24 h, 48 h, and 120 h post-hatching (hpf) of zebrafish embryos obtained by artificial fertilization (n=9/group). (G) Malformation rate determined at 120 h post-hatching of zebrafish embryos obtained by artificial fertilization (n=9/group). Results are represented as means±standard errors of the mean (SEMs). See Table S1 for definitions of total and progressive motility and linearity of spermatozoa. Data are reported in Excel Table S1. Note: DBDPE, decabromodiphenyl ethane; DMSO, dimethyl sulfoxide. *p<0.05 indicates a significant difference between DBDPE exposure and solvent control groups, by one-way analysis of variance (ANOVA) followed by the post hoc least significant difference (LSD) test; n.s. indicates no significant difference between blank control and solvent control (0.05% DMSO) groups.

Effects of DBDPE in vivo exposure on motility parameters and ultrastructure morphology of zebrafish spermatozoa. (A) Schematic diagram of collecting sperm after in vivo exposure of zebrafish for spermatozoa motility and ultrastructural imaging. The illustration was in part created in BioRender (2024) https://BioRender.com/o11a377. (B) Total motility (TM; %) of spermatozoa (n=910). (C) Progressive motility (PM; %) of spermatozoa (n=910). (D) Average path velocity (VAP; μm/s) of spermatozoa (n=910). (E) Straight-line velocity (VSL; μm/s) of spermatozoa (n=910). (F) Curvilinear velocity (VCL; μm/s) of spermatozoa (n=910). (G) Linearity (LIN; %) of spermatozoa (n=910). Box plots represent the median values with upper and lower quartiles; whiskers extend to the maximum to minimum. (H) Typical spermatozoa (normal spermatozoa from control group) morphology observed by scanning electron microscope. (H′) Magnification of a typical zebrafish spermatozoa head. The solid red line indicates head length, and the dotted blue line indicates head width measured in the present study. (I) Spermatozoa tail length measured in each group. (J) Spermatozoa head length measured in each group. (K) Spermatozoa head width measured in each group. Ten semen samples were assessed for different spermatozoa motility parameters in each group. Zebrafish spermatozoa (n=7896 spermatozoa/group) were randomly selected for measurement of tail length, head length, and head width in each group. Results are represented as means±standard errors of the mean (SEMs). See Table S1 for definitions of TM, PM, VAP, VSL, VCL, and LIN. Data are reported in Excel Table S2. Note: CASA, computer-assisted sperm analysis; DBDPE, decabromodiphenyl ethane; F, flagellum; H, head; MP, midpiece; TP, terminal piece. *p<0.05, **p<0.01, and ***p<0.001 indicate significant differences between exposure and control groups, by one-way analysis of variance (ANOVA) followed by the post hoc least significant difference (LSD) test.

Histological observations of male zebrafish testes after 2-month in vivo exposure to DBDPE. (A−E) Typical hematoxylin/eosin–stained sections of testes in 0, 0.1, 1, 10, and 100 nM-exposure groups, respectively. (F) Proportion quantification of germ cells at different developmental stages in testes (n=69 fish/group). Results are represented as means±standard errors of the mean (SEMs). Scale bar: 50μm. Data are reported in Excel Table S3. Note: DBDPE, decabromodiphenyl ethane; SPC, spermatocytes; SPD, spermatozoa; SPG, spermatogonia. *p<0.05, **p<0.01, and ***p<0.001 indicate significant differences between exposure and control groups, by one-way analysis of variance (ANOVA) followed by the post hoc least significant difference (LSD) test.

Whole-proteome and phosphoproteome analysis of male zebrafish testes after in vivo exposure to 100 nM DBDPE. (A) Schematic diagram of proteome and phosphoproteome analysis. The illustration was in part created in BioRender (2024) https://BioRender.com/x32w463. (B) Volcano plot of quantified proteins in 100 nM DBDPE-treated zebrafish testes. (C) Volcano plot of quantified phosphosites in 100 nM DBDPE-treated zebrafish testes. Upward triangle (filled in red; on the upper right corner) and upside-down triangle (filled in green; on the upper left corner) in (B) and (C) indicate up-regulation and down-regulation, respectively; gray dots indicate no significant difference. (D) Significantly enriched KEGG pathways of differentially expressed proteins (DEPs) from whole-proteome data. (E) Significantly enriched KEGG pathways of proteins harboring differentially phosphorylated sites from phosphoproteome data. The size of the dots in (D) and (E) represents the number of DEPs in the pathway, and the color of the dots represents the enrichment factors of KEGG pathway. (F) Protein–protein interaction (PPI) network after exposure to 100 nM DBDPE. The illustration was created in BioRender (2023) https://BioRender.com/o93k219. Each large oval represents protein expression level, and smaller ovals with a tail on top represent phosphorylation levels of specific phosphorylation sites of the protein. Solid line boxes and dotted line boxes respectively indicate up-regulation and down-regulation in the proteome; gray-filled ovals indicate proteins without significant differences. Solid line circles and dotted line circles respectively indicate up-regulation and down-regulation in the phosphoproteome. Color intensity is proportional to log2 (fold change). Data are reported in Excel Table S4. Note: DBDPE, decabromodiphenyl ethane; KEGG, Kyoto Encyclopedia of Genes and Genomes; PI3K-AKT, phosphoinositide 3-kinase/protein kinase B; SNARE, soluble N-ethylmaleimide-sensitive factor attachment protein receptor; TiO2, titanium dioxide.

DNA damage in zebrafish testes exposed to DBDPE in vivo. (A) DNA damage in zebrafish testes detection by immunofluorescence staining against the histone protein γ-H2AX. The representative images show DAPI-stained (blue) nuclei with nuclear γ-H2AX foci in red. Scale bar: 20μm. (B) Representative positive signals detected in SPD (indicated by white bold arrow), SPC-I (indicated by white dashed arrow; zygotene spermatocytes, signals dispersed within the nucleus), and SPC-II (indicated by white thin arrow; leptotene spermatocytes, strong signals concentrated within in the nucleus). (C) Ratio of fluorescence intensity of γ-H2AX to the corresponding fluorescence intensity of DAPI in SPD. (D) Ratio of fluorescence intensity of γ-H2AX signals to the corresponding fluorescence intensity of DAPI in SPC-I. (E) Ratio of fluorescence intensity of γ-H2AX signals to the corresponding fluorescence intensity of DAPI in SPC-II. Results are represented as means±standard errors of the mean (SEMs), n=6 testes. Data are reported in Excel Table S5. Note: DAPI, 4′,6-diamidino-2′-phenylindole; DBDPE, decabromodiphenyl ethane; SPC, spermatocytes; SPD, spermatozoa. *p<0.05, **p<0.01, and ***p<0.001 indicate significant differences between exposure and control groups, by one-way analysis of variance (ANOVA) followed by the post hoc least significant difference (LSD) test.

Germ cell apoptosis and expression of proteins related to cell apoptosis in zebrafish testes exposed to DBDPE in vivo. (A) Apoptosis detection in zebrafish testes by immunofluorescence staining using TUNEL assay. The representative images show DAPI-stained (blue) nuclei with TUNEL-positive signals in green. Scale bar: 20μm. (B) Statistical analysis of the total number of TUNEL-positive cells relative to the section areas. Each dot in (B) represents one replicate data point (mean value of each testis). The dot numbers represent the data size (n=812) for statistical analysis. (C) Western blotting analyses using antibodies against cleaved caspase-3, cleaved PARP, p-JNK, and GAPDH in testes tissues. The numbers on the left represent molecular weight. (D) Quantification of the abundances of proteins relative to GAPDH (n=3). Results are represented as means±standard errors of the mean (SEMs). Data are reported in Excel Table S6. Note: DAPI, 4′,6-diamidino-2′-phenylindole; DBDPE, decabromodiphenyl ethane; GAPDH, glyceraldehyde-3-phosphate dehydrogenase; PARP, poly(adenosine diphosphosphate-ribose) polymerase; p-JNK, phospho-c-jun N-terminal kinase; TUNEL, terminal deoxynucleotidyl transferase deoxynucleotide triphosphate nick-end labeling (assay). *p<0.05, **p<0.01, and ***p<0.001 indicate significant differences between exposure and control groups, by one-way analysis of variance (ANOVA) followed by the post hoc least significant difference (LSD) test.

Energy metabolic level in zebrafish testes exposed to DBDPE in vivo. (A) NAD+/NADH ratio in testicular tissues (n=68). (B) Mitochondrial membrane potential (MMP) of testicular tissues (n=78). (C) ATP content in testicular tissues (n=48). (D) ROS levels in testicular tissues (n=68). (E) Glucose levels in testicular tissues (n=4). (F) Intracellular lactate/pyruvate ratio in testicular tissues (n=3). (G) LDH content in testicular tissues (n=78). (H) LDH activity in testicular tissues (n=68). Each dot in (A–H) represents one replicate data point. Results are represented as means±standard errors of the mean (SEMs). Data are reported in Excel Table S7. Note: ATP, adenosine triphosphate; DBDPE, decabromodiphenyl ethane; G, green; LDH, lactate dehydrogenase; NAD+, nicotinamide adenine dinucleotide; NADH, nicotinamide adenine dinucleotide reduced; R, red; ROS, reactive oxygen species. *p<0.05, **p<0.01, and ***p<0.001 indicate significant differences between exposure and control groups, by one-way analysis of variance (ANOVA) followed by the post hoc least significant difference (LSD) test.

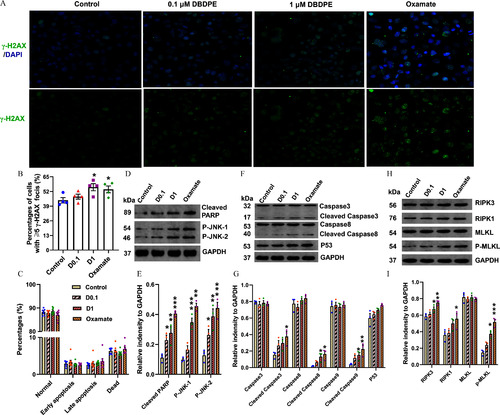
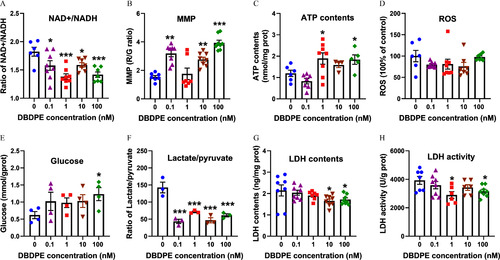
DNA damage and expression of proteins related to apoptosis or necroptosis in mouse spermatogonial GC-1 cells exposed to DBDPE and oxamate (LDH inhibitor) in vitro. (A) DNA damage in zebrafish testes detection by immunofluorescence staining against the histone protein γ-H2AX. The representative images show DAPI-stained (blue) nuclei with nuclear γ-H2AX foci in green. (B) Percentages of GC-1 cells with 5γ-H2AX foci (n=4). (C) Cell apoptosis detection by flow cytometry (FCM) using an Annexin V-FITC Apoptosis Detection Kit (n=78). (D) Western blotting analyses carried out with antibodies against caspase-3, cleaved caspase-3, caspase-8, cleaved caspase-8, P53, and GAPDH in GC-1 cells. (E) Western blotting analyses carried out with antibodies against cleaved PARP, p-JNK, and GAPDH in GC-1 cells. (F) Western blotting analyses carried out with antibodies against RIPK3, RIPK1, MLKL, p-MLKL, and GAPDH in GC-1 cells. (H–I) Quantification of the abundances of proteins relative to GAPDH (n=3). Each dot in (E–I) represents one replicate data point (one well of cells/replicate). The dot numbers represent the data size for statistical analysis. Results are represented as means±standard errors of the mean (SEMs). Data are reported in Excel Table S8. Note: DBDPE, decabromodiphenyl ethane; FITC, fluorescein isothiocyanate; glyceraldehyde-3-phosphate dehydrogenase; LDH, lactate dehydrogenase; MLKL, mixed lineage kinase domain-like; PARP, poly(adenosine diphosphosphate-ribose) polymerase; p-JNK, phospho-c-jun N-terminal kinase; RIPK, receptor-interacting serine-threonine kinase 3. *p<0.05, **p<0.01, and ***p<0.001 indicate significant differences between exposure and control groups, by one-way analysis of variance (ANOVA) followed by the post hoc least significant difference (LSD) test.

Energy metabolic levels in mouse spermatogonial GC-1 cells exposed to DBDPE and oxamate (LDH inhibitor) in vitro. (A) Glucose content in GC-1 cells treated for 72 h (n=5). (B) LDH activity in GC-1 cells treated for 72 h (n=57). (C) Mitochondrial membrane potential (MMP) of GC-1 cells treated for 72 h (n=5). (D) ROS levels in GC-1 cells treated for 72 h (n=4). (E) Schematic diagram of the Seahorse XF real-time ATP rate assay. The relative contributions of mitochondrial oxidative phosphorylation and glycolysis to ATP can be determined. The illustration was created in BioRender (2023) https://BioRender.com/p67n031. (F) Quantification of basal respiration in response to DBDPE or oxamate (LDH inhibitor) after 72 h of treatment (n=3). (G) Glycolysis-derived ATP (glycoATP)/mitochondrial oxidative phosphorylation-derived ATP (mitoATP) ratio in GC-1 cells exposed to DBDPE (0.1μM and 1μM) and oxamate (LDH inhibitor) for 72 h (n=34). Each dot in (A–D,F,G) represents one replicate data point (one well of cells/replicate). (H) Proposed action of DBDPE on glycolysis and oxidative phosphorylation based on findings of the in vitro and in vivo studies. The illustration was created in BioRender (2023) https://BioRender.com/g29w956. Upward dashed arrows (in red) indicate elevation. The red cross indicates inhibition. Results are represented as means±standard errors of the mean (SEMs). Data are reported in Excel Table S9. Note: ATP, adenosine triphosphate; D, DBDPE, decabromodiphenyl ethane; G, green; LDH, lactate dehydrogenase; NAD+, nicotinamide adenine dinucleotide; NADH, nicotinamide adenine dinucleotide reduced; R, red; ROS, reactive oxygen species; TCA, tricarboxylic acid (cycle). *p<0.05, **p<0.01, and ***p<0.001 indicate significant differences between exposure and control groups, by one-way analysis of variance (ANOVA) followed by the post hoc least significant difference (LSD) test.

Acknowledgments
This image is the copyrighted work of the attributed author or publisher, and ZFIN has permission only to display this image to its users. Additional permissions should be obtained from the applicable author or publisher of the image. Full text @ Environ. Health Perspect.