FIGURE

Figure 7.

ID
ZDB-FIG-241123-15
Publication
Yang et al., 2024 - Integrated Studies on Male Reproductive Toxicity of Decabromodiphenyl Ethane in Zebrafish Spermatozoa Ex Vivo, Male Zebrafish in Vivo, and GC-1 Cells in Vitro
Other Figures
All Figure Page
Back to All Figure Page
Figure 7.

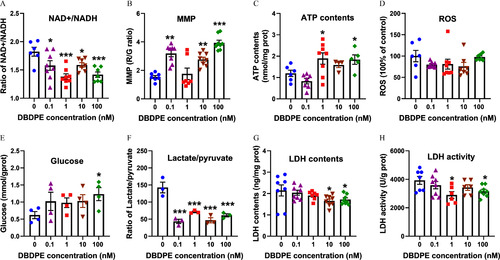
Energy metabolic level in zebrafish testes exposed to DBDPE in vivo. (A) NAD+/NADH ratio in testicular tissues (n=68). (B) Mitochondrial membrane potential (MMP) of testicular tissues (n=78). (C) ATP content in testicular tissues (n=48). (D) ROS levels in testicular tissues (n=68). (E) Glucose levels in testicular tissues (n=4). (F) Intracellular lactate/pyruvate ratio in testicular tissues (n=3). (G) LDH content in testicular tissues (n=78). (H) LDH activity in testicular tissues (n=68). Each dot in (A–H) represents one replicate data point. Results are represented as means±standard errors of the mean (SEMs). Data are reported in Excel Table S7. Note: ATP, adenosine triphosphate; DBDPE, decabromodiphenyl ethane; G, green; LDH, lactate dehydrogenase; NAD+, nicotinamide adenine dinucleotide; NADH, nicotinamide adenine dinucleotide reduced; R, red; ROS, reactive oxygen species. *p<0.05, **p<0.01, and ***p<0.001 indicate significant differences between exposure and control groups, by one-way analysis of variance (ANOVA) followed by the post hoc least significant difference (LSD) test.

Expression Data

Expression Detail
Antibody Labeling
Phenotype Data

Phenotype Detail
Acknowledgments
This image is the copyrighted work of the attributed author or publisher, and ZFIN has permission only to display this image to its users. Additional permissions should be obtained from the applicable author or publisher of the image. Full text @ Environ. Health Perspect.