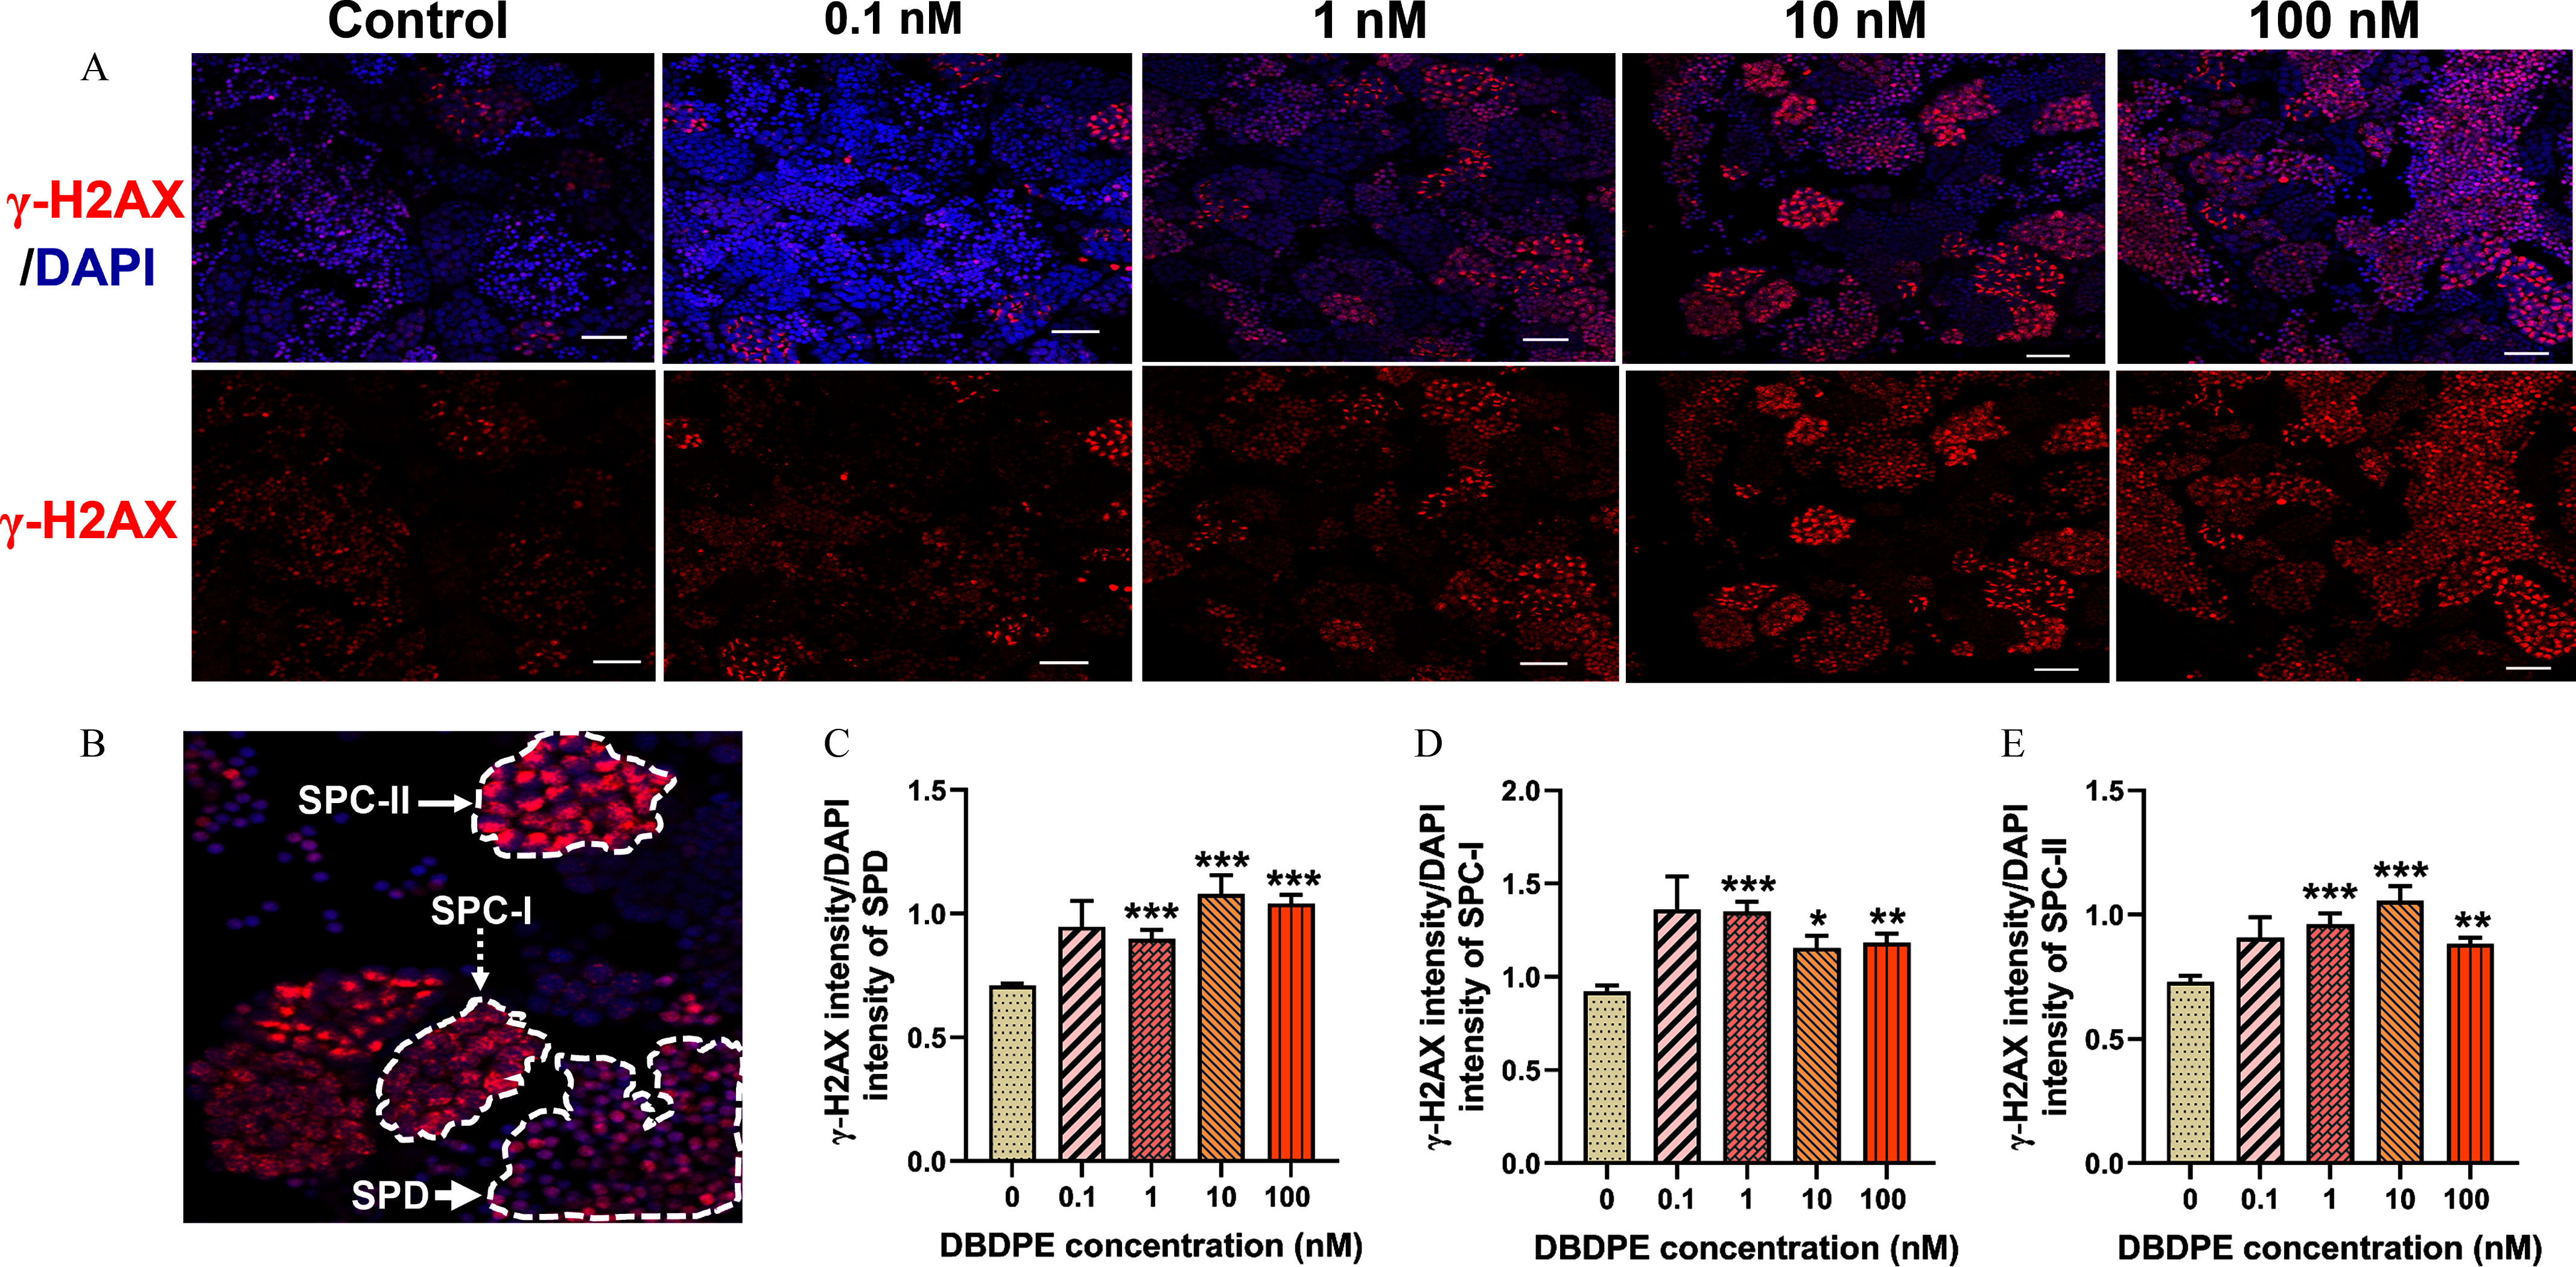
IMAGE

Figure 5.

ID
ZDB-IMAGE-241123-14
Source
Figures for Yang et al., 2024
Image
Figure Caption

Figure 5.

DNA damage in zebrafish testes exposed to DBDPE in vivo. (A) DNA damage in zebrafish testes detection by immunofluorescence staining against the histone protein γ-H2AX. The representative images show DAPI-stained (blue) nuclei with nuclear γ-H2AX foci in red. Scale bar: 20μm. (B) Representative positive signals detected in SPD (indicated by white bold arrow), SPC-I (indicated by white dashed arrow; zygotene spermatocytes, signals dispersed within the nucleus), and SPC-II (indicated by white thin arrow; leptotene spermatocytes, strong signals concentrated within in the nucleus). (C) Ratio of fluorescence intensity of γ-H2AX to the corresponding fluorescence intensity of DAPI in SPD. (D) Ratio of fluorescence intensity of γ-H2AX signals to the corresponding fluorescence intensity of DAPI in SPC-I. (E) Ratio of fluorescence intensity of γ-H2AX signals to the corresponding fluorescence intensity of DAPI in SPC-II. Results are represented as means±standard errors of the mean (SEMs), n=6 testes. Data are reported in Excel Table S5. Note: DAPI, 4′,6-diamidino-2′-phenylindole; DBDPE, decabromodiphenyl ethane; SPC, spermatocytes; SPD, spermatozoa. *p<0.05, **p<0.01, and ***p<0.001 indicate significant differences between exposure and control groups, by one-way analysis of variance (ANOVA) followed by the post hoc least significant difference (LSD) test.

Acknowledgments
This image is the copyrighted work of the attributed author or publisher, and ZFIN has permission only to display this image to its users. Additional permissions should be obtained from the applicable author or publisher of the image. Full text @ Environ. Health Perspect.