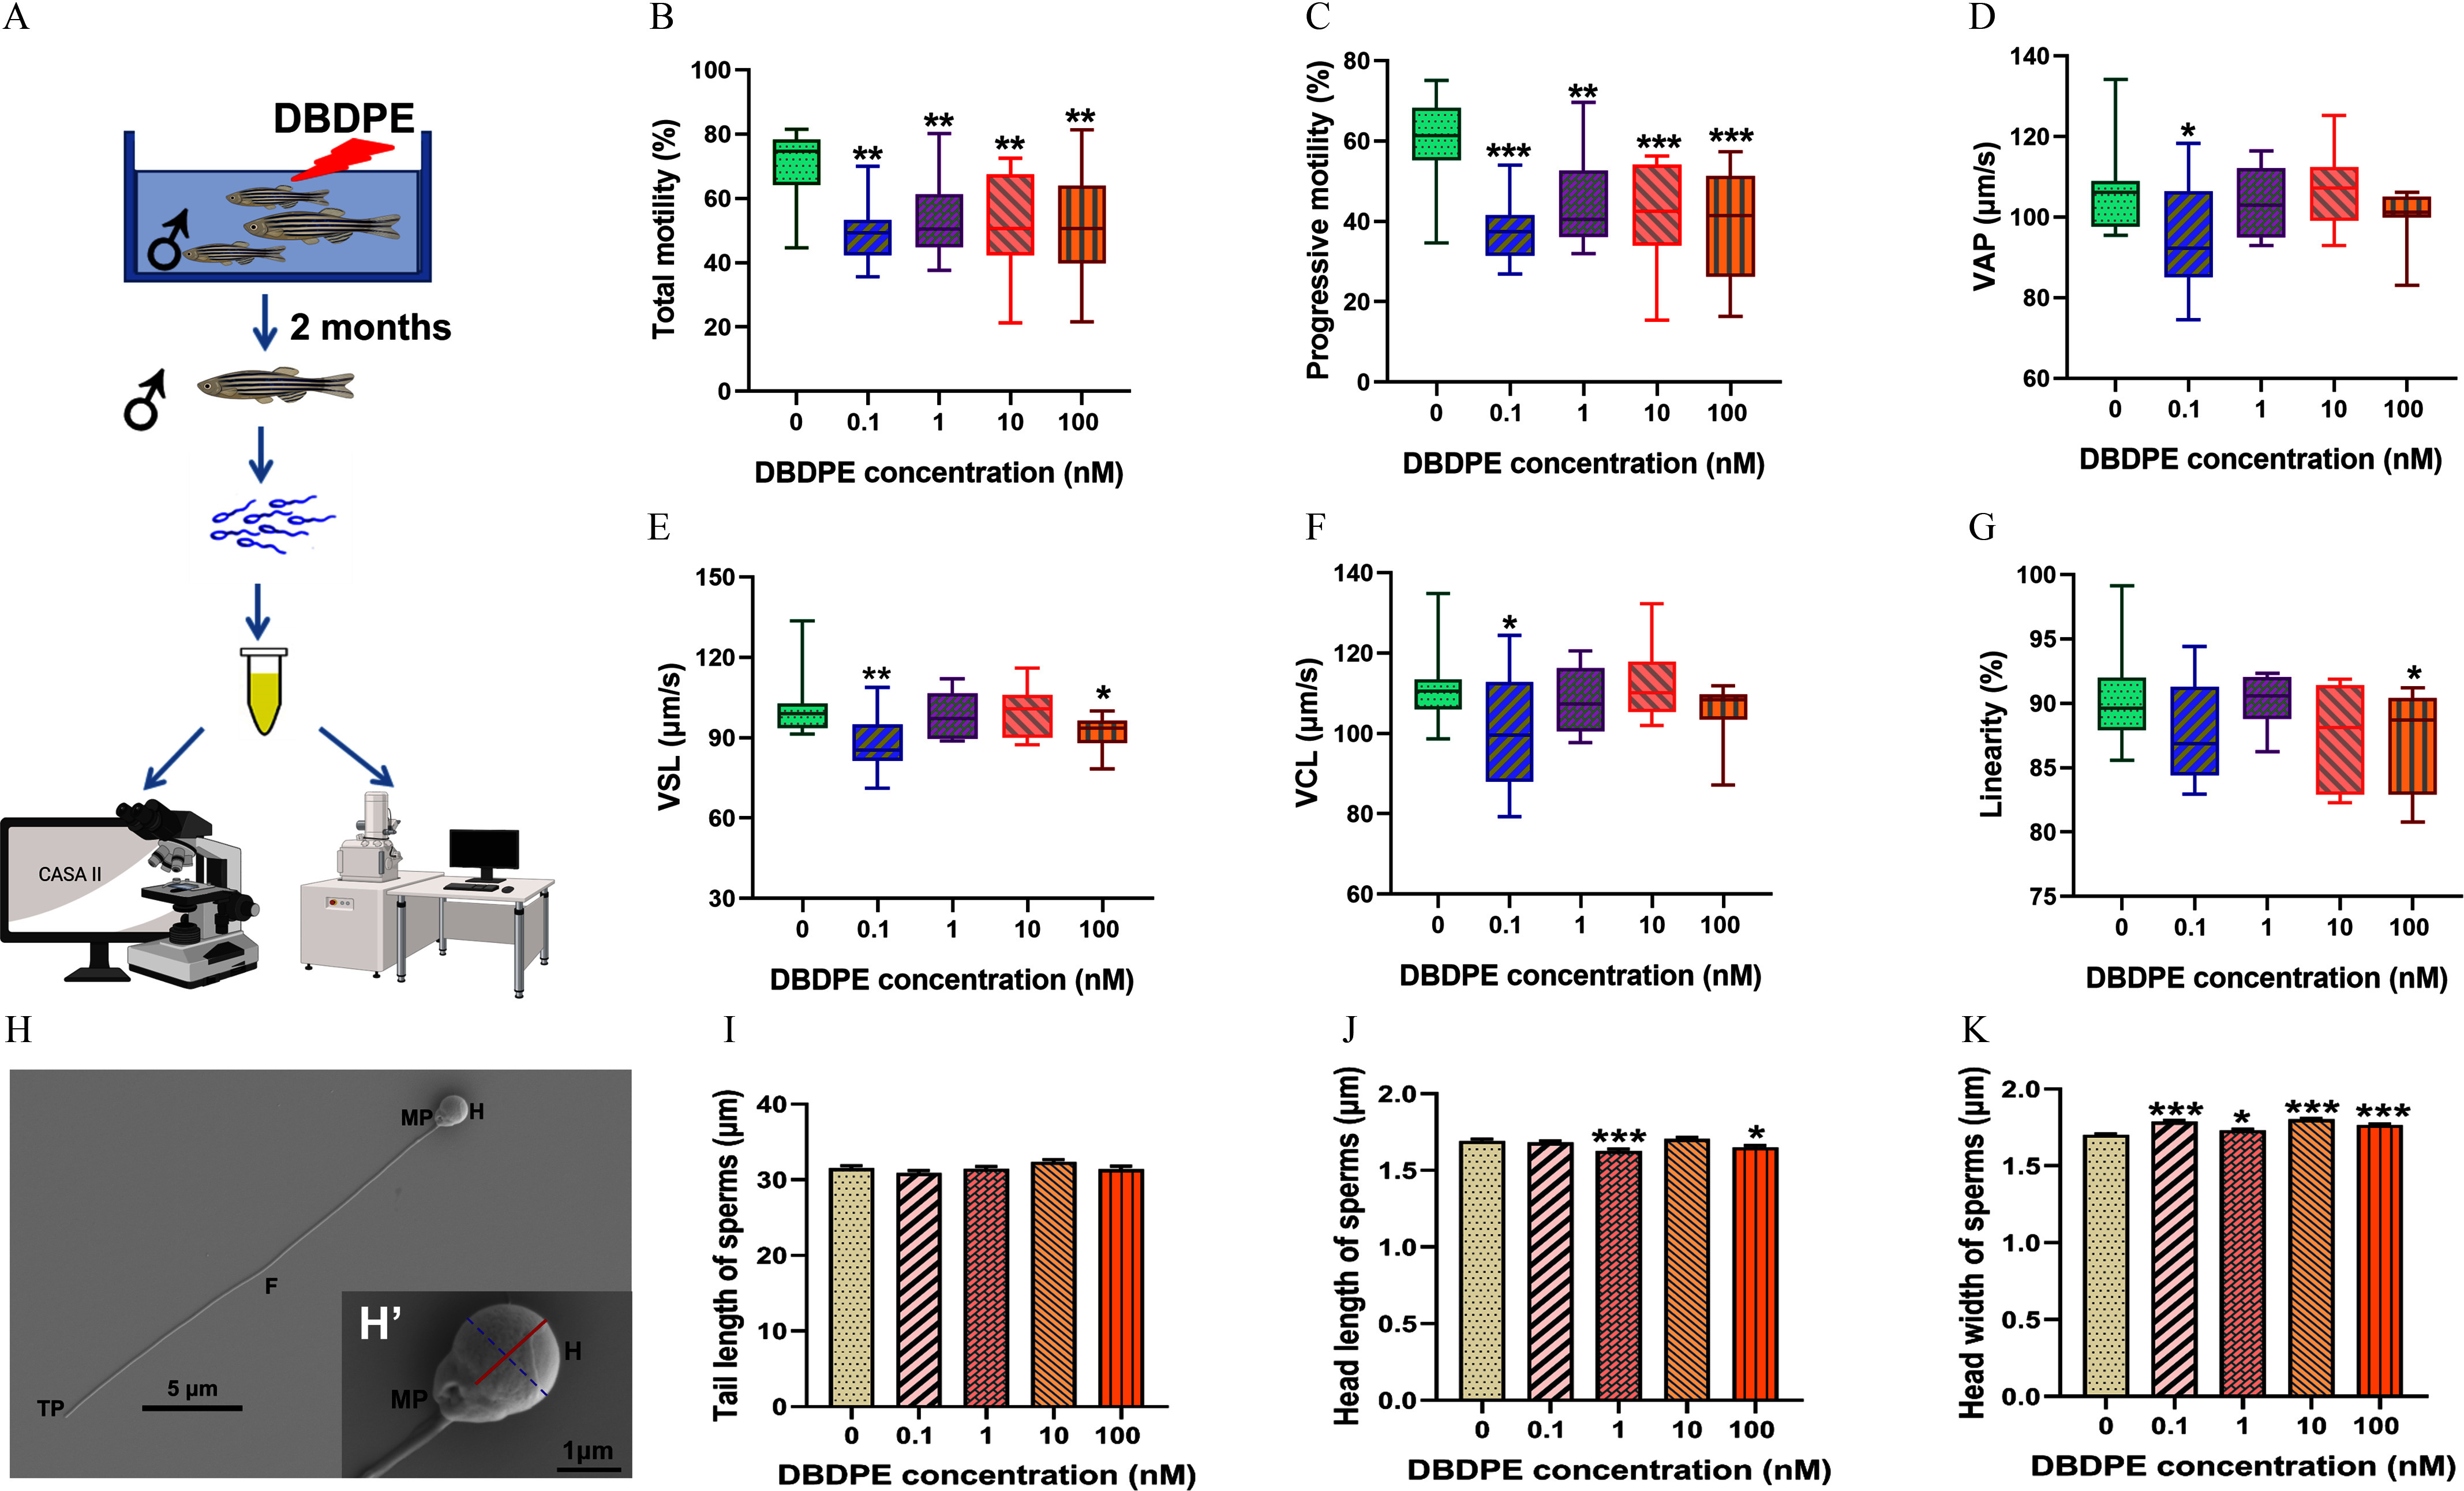
IMAGE

Figure 2.

ID
ZDB-IMAGE-241123-1
Source
Figures for Yang et al., 2024
Image
Figure Caption

Figure 2.

Effects of DBDPE in vivo exposure on motility parameters and ultrastructure morphology of zebrafish spermatozoa. (A) Schematic diagram of collecting sperm after in vivo exposure of zebrafish for spermatozoa motility and ultrastructural imaging. The illustration was in part created in BioRender (2024) https://BioRender.com/o11a377. (B) Total motility (TM; %) of spermatozoa (n=910). (C) Progressive motility (PM; %) of spermatozoa (n=910). (D) Average path velocity (VAP; μm/s) of spermatozoa (n=910). (E) Straight-line velocity (VSL; μm/s) of spermatozoa (n=910). (F) Curvilinear velocity (VCL; μm/s) of spermatozoa (n=910). (G) Linearity (LIN; %) of spermatozoa (n=910). Box plots represent the median values with upper and lower quartiles; whiskers extend to the maximum to minimum. (H) Typical spermatozoa (normal spermatozoa from control group) morphology observed by scanning electron microscope. (H′) Magnification of a typical zebrafish spermatozoa head. The solid red line indicates head length, and the dotted blue line indicates head width measured in the present study. (I) Spermatozoa tail length measured in each group. (J) Spermatozoa head length measured in each group. (K) Spermatozoa head width measured in each group. Ten semen samples were assessed for different spermatozoa motility parameters in each group. Zebrafish spermatozoa (n=7896 spermatozoa/group) were randomly selected for measurement of tail length, head length, and head width in each group. Results are represented as means±standard errors of the mean (SEMs). See Table S1 for definitions of TM, PM, VAP, VSL, VCL, and LIN. Data are reported in Excel Table S2. Note: CASA, computer-assisted sperm analysis; DBDPE, decabromodiphenyl ethane; F, flagellum; H, head; MP, midpiece; TP, terminal piece. *p<0.05, **p<0.01, and ***p<0.001 indicate significant differences between exposure and control groups, by one-way analysis of variance (ANOVA) followed by the post hoc least significant difference (LSD) test.

Acknowledgments
This image is the copyrighted work of the attributed author or publisher, and ZFIN has permission only to display this image to its users. Additional permissions should be obtained from the applicable author or publisher of the image. Full text @ Environ. Health Perspect.