IMAGE

Figure 3.

ID
ZDB-IMAGE-241123-7
Source
Figures for Yang et al., 2024
Image
Figure Caption

Figure 3.

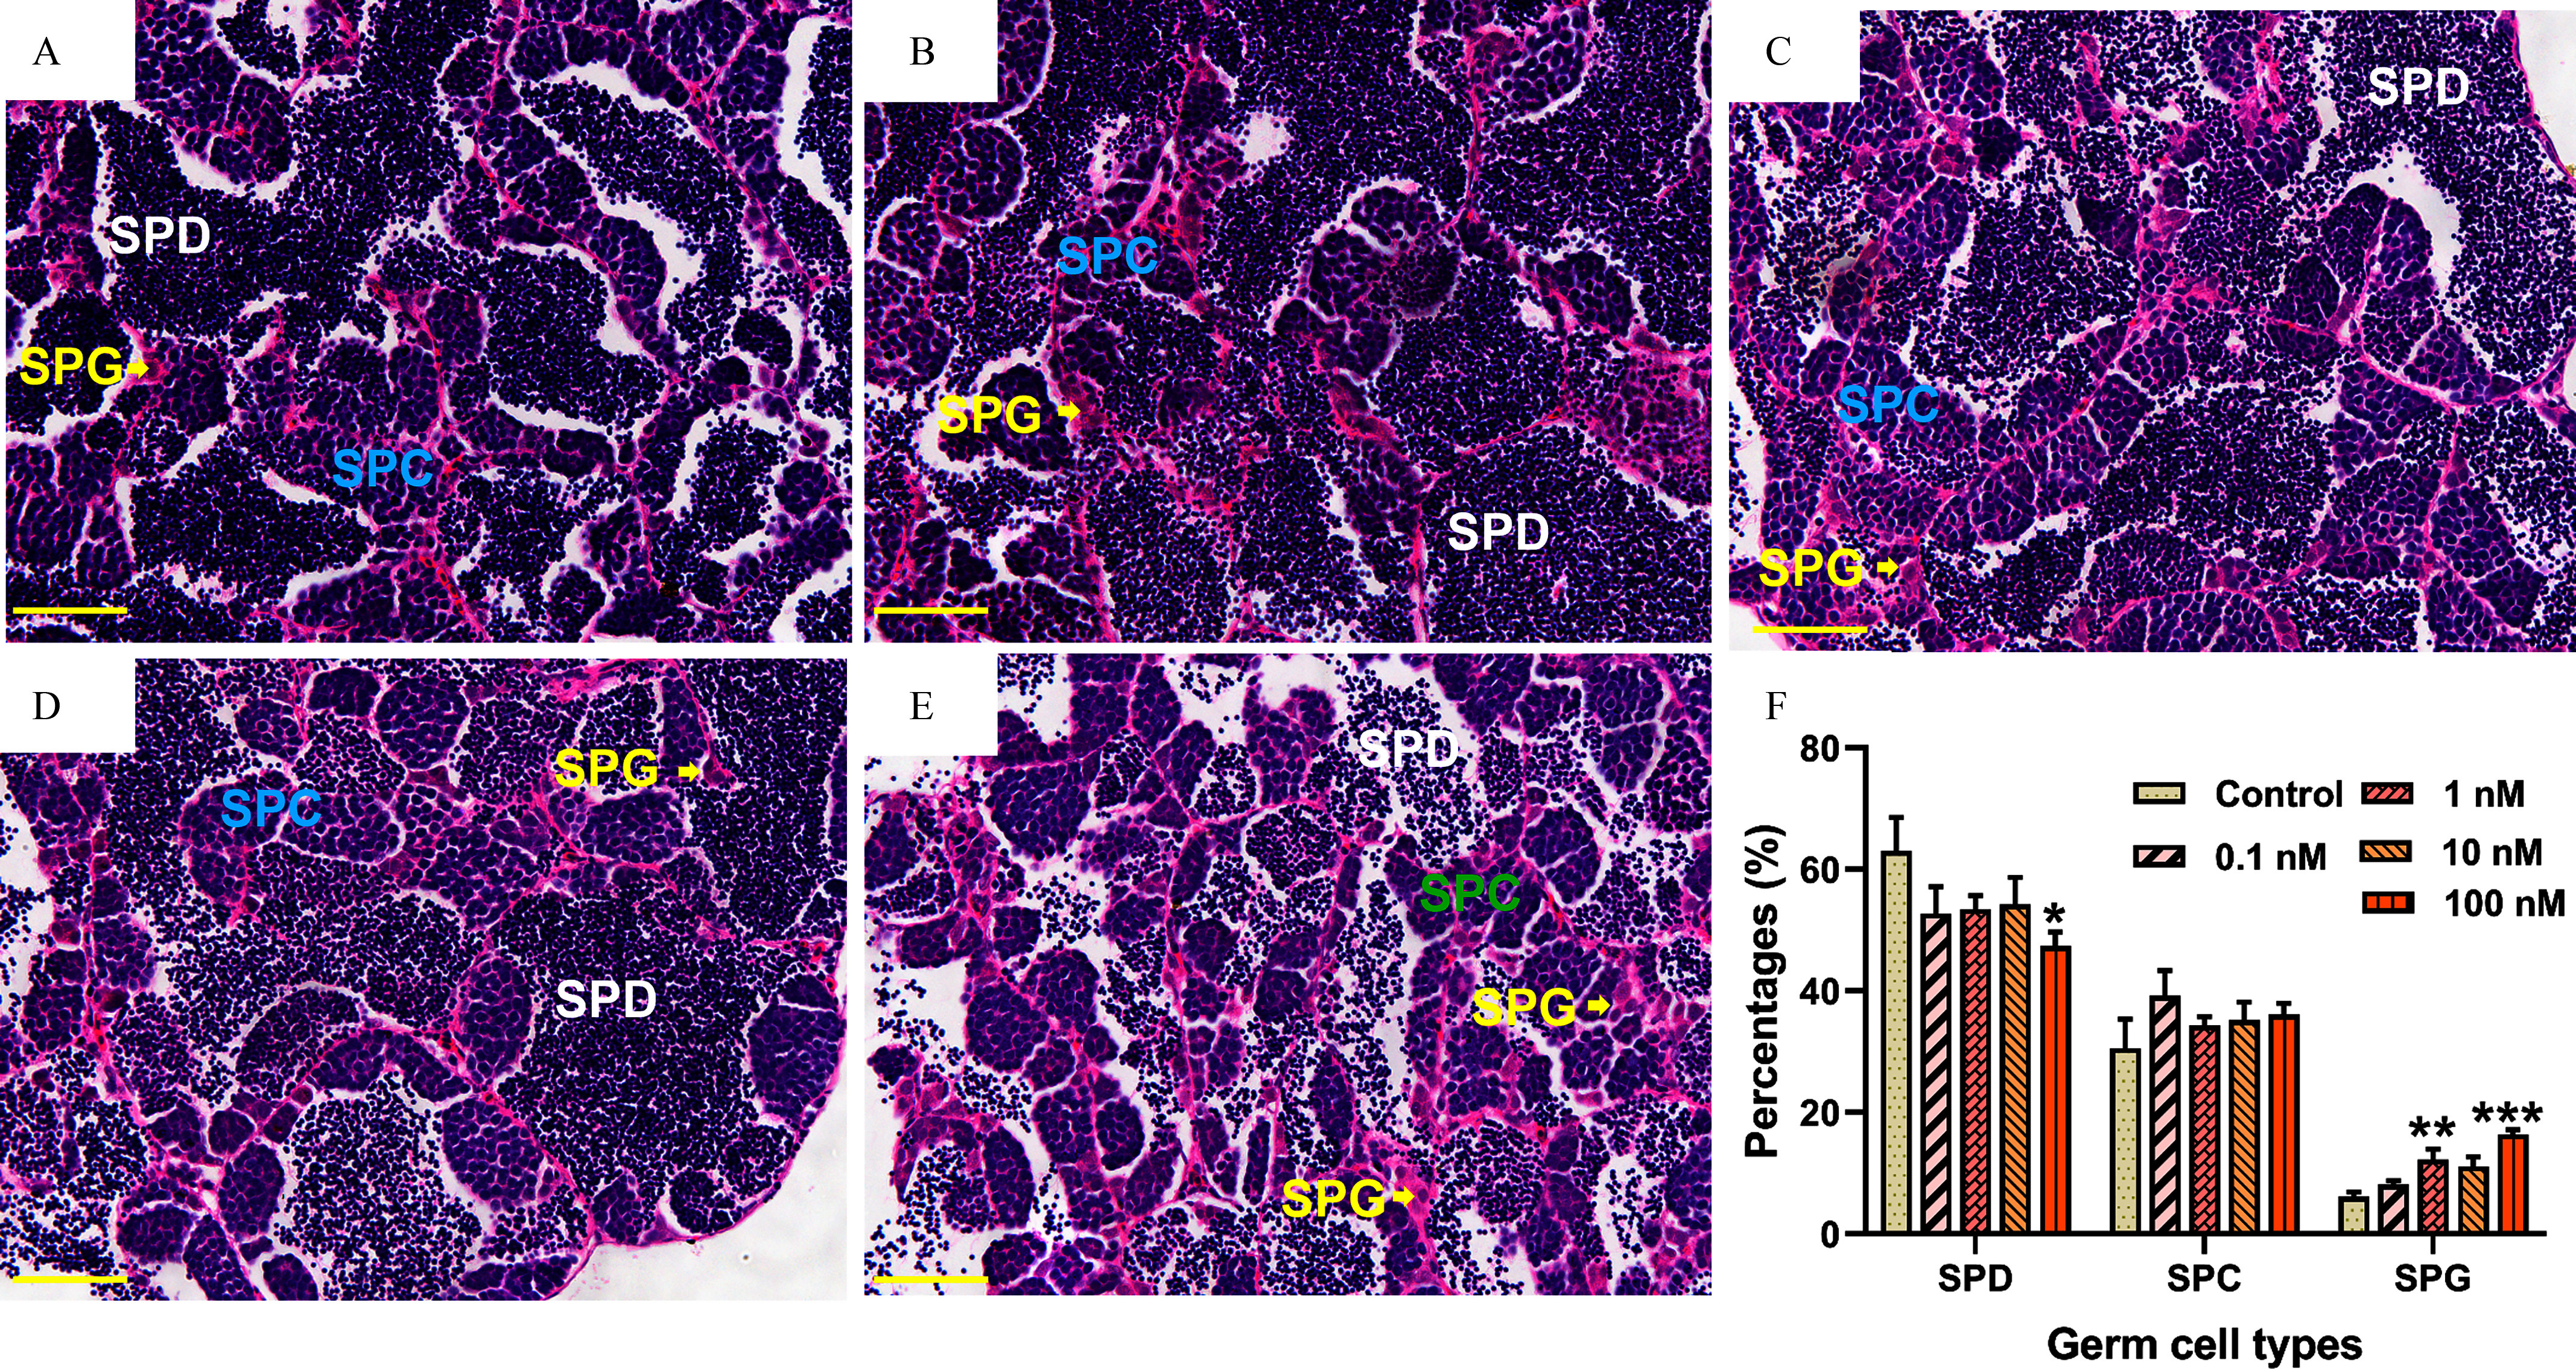
Histological observations of male zebrafish testes after 2-month in vivo exposure to DBDPE. (A−E) Typical hematoxylin/eosin–stained sections of testes in 0, 0.1, 1, 10, and 100 nM-exposure groups, respectively. (F) Proportion quantification of germ cells at different developmental stages in testes (n=69 fish/group). Results are represented as means±standard errors of the mean (SEMs). Scale bar: 50μm. Data are reported in Excel Table S3. Note: DBDPE, decabromodiphenyl ethane; SPC, spermatocytes; SPD, spermatozoa; SPG, spermatogonia. *p<0.05, **p<0.01, and ***p<0.001 indicate significant differences between exposure and control groups, by one-way analysis of variance (ANOVA) followed by the post hoc least significant difference (LSD) test.

Acknowledgments
This image is the copyrighted work of the attributed author or publisher, and ZFIN has permission only to display this image to its users. Additional permissions should be obtained from the applicable author or publisher of the image. Full text @ Environ. Health Perspect.