
- Title
-
Genetic requirement of dact1/2 to regulate noncanonical Wnt signaling and calpain 8 during embryonic convergent extension and craniofacial morphogenesis
- Authors
- Carroll, S.H., Schafer, S., Kawasaki, K., Tsimbal, C., Jule, A.M., Hallett, S.A., Li, E., Liao, E.C.
- Source
- Full text @ Elife
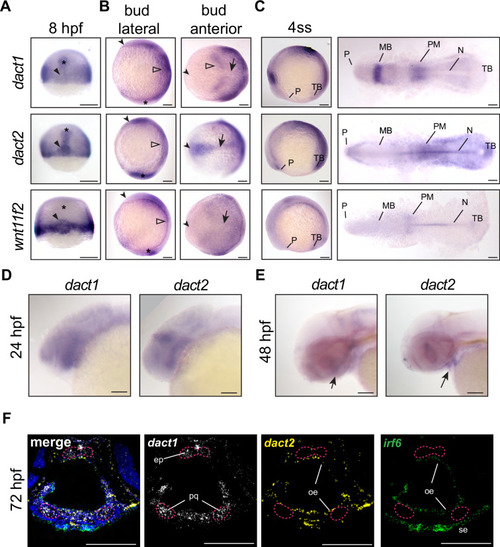
Unique and shared dact1 and dact2 gene expression domains during zebrafish development. (A?C) Representative images of wholemount in situ hybridization showing dact1, dact2, and wnt11f2 gene expression patterns. (A) At 8 hpf, dact2 and wnt11f2 are highly expressed in the dorsal margin and presumptive Nieuwkoop center of the gastrulating embryo, with dact1 being weakly detected (arrowhead). In contrast to wnt11f2, dact1, and dact2 are expressed in the presumptive dorsal mesoderm (asterisk). (B) Lateral (anterior to the left of page) and anterior (dorsal side toward top of page) views of bud-stage embryos. dact2 and wnt11f2 transcripts are both detected in the tailbud (asterisk) while dact2 is additionally expressed in the axial mesoderm (arrow). dact1 gene expression is concentrated to the paraxial mesoderm and the neuroectoderm (open arrowheads). (C) Lateral and flat-mount views of 4 ss embryos. dact2 is expressed in the anterior neural plate and polster (P), notochord (N), paraxial and presomitic mesoderm (PM) and tailbud (TB). In contrast, dact1 is expressed in the midbrain (MB) and the paraxial and presomitic mesoderm. (D, E) Representative lateral (anterior to left of page) images of wholemount in situ hybridization showing dact1 and dact2 expression patterns. (D) At 24 hpf expression is detected in the developing head. (E) At 48 hpf expression is detected in the developing craniofacial structures (arrow). (F) Representative images of RNAscope in situ hybridization analysis of dact1 (white) and dact2 (yellow) and irf6 (green) expression in transverse section of 72 hpf embryos. dact1 is expressed in the ethmoid plate (ep) and palatoquadrate (pq) orofacial cartilage, while dact2 is expressed in the oral epithelium (oe). The epithelial marker irf6 is expressed in the oe and surface epithelium (se). Dapi (blue). Scale bar: 100 ?m. |
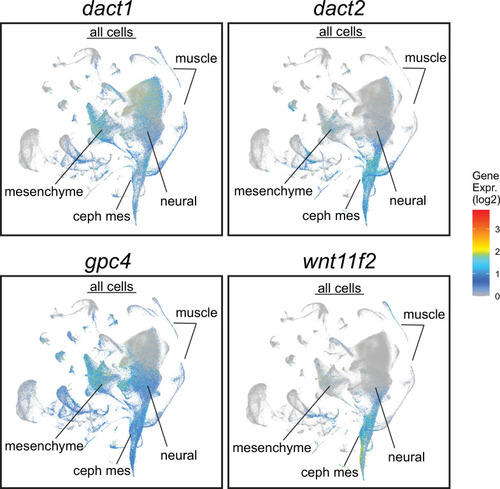
Daniocell single-cell RNAseq analysis with a display of Cephalic mesoderm (ceph mes), mesenchyme, neural ectoderm, and muscle clusters are noted. |

Impaired convergent extension in dact1/2 compound mutants. (A) Inter-cross of compound heterozygotes yield embryos with different degrees of axis extension that correspond to the dact1 and dact2 genotypes. Representative lateral images of embryos at 12 hpf. The yellow line indicates body axis angle measured from the anterior point of the head, the center of the yolk, to the end of the tail. (B) Quantification of body axis angle. Numbers represent the difference in angle relative to the average wildtype embryo. Asterisk indicates genotypes with angles significantly different from wildtype. ANOVA p < 0.5 n = 3?21 embryos. Error bars: � SEM. (C) Representative bud stage wildtype and dact1/2?/? mutant embryos stained for gsc (prechordal plate), pax2a (midbrain/hindbrain boundary), and krox20 (rhombomere 3). Asterisk indicates lack of krox20 expression in dact1/2?/? mutant. Scale bar = 200 ?m (D) Representative flat mounts of 1?2 ss wildtype and dact1/2 mutant embryos stained for zic1 (telencephalon), pax2a and tbx6 (ventrolateral mesoderm). (E) Representative flat mounts of 10 ss wildtype and dact1/2?/? mutant embryos stained for ctsl1b (hatching gland), zic1, pax2a, krox20, and myo1d (somites). |

Characterization of CRISPR/Cas9 generated ( |

Loss of ( |

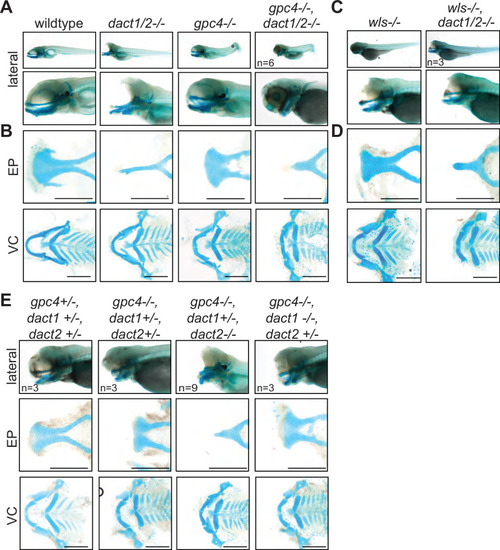
Midface development requires ( |
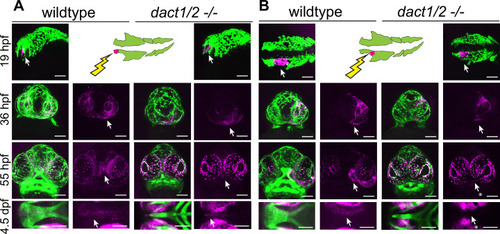
Anterior neural crest cells of the Lineage tracing of wildtype and |
A nonoverlapping functional role for ( |

Single-cell RNAseq of 4 ss wildtype, dact1/2?/? mutant, and gpc4?/? mutants. (A) Summary schematic showing similar phenotypes in dact1/2?/? and gpc4?/? mutants at 12 hpf and divergent phenotypes at 4 dpf. Single-cell RNAseq was performed during axis extension to compare and contrast dact1/2?/? and gpc4?/? transcriptional programs. Uniform manifold approximation and projection (UMAP) showing cluster identification. (B) UMAP of cell clusters identified by single-cell RNAseq. (C) Dot plot showing the most differentially expressed genes between clusters. (D) UMAP showing dact1, dact2, and gpc4 expression in wildtype embryos. |
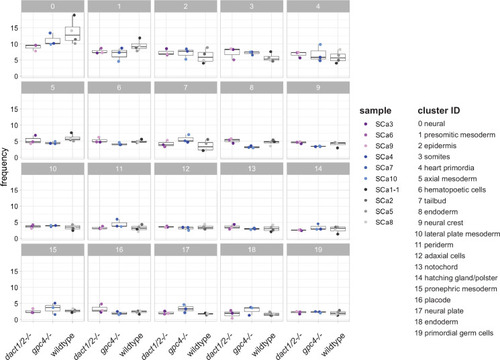
Cluster abundance across genotype groups. Scatter box plots showing the frequency of each identified cell cluster between |
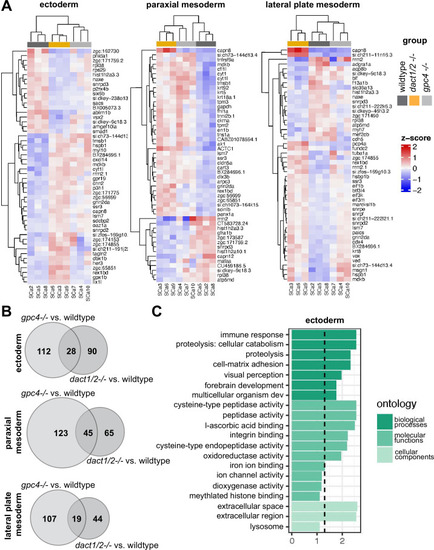
Pseudobulk differential expression analysis of single-cell RNAseq data. (A) Heatmaps showing the 50 most differentially expressed genes (DEGs) in 3 major cell types; ectoderm (clusters 4, 5, 6, 7), paraxial mesoderm (clusters 10, 11, 12), and lateral plate mesoderm (clusters 15, 16, 17,18) between dact1/2?/? mutants and wildtype and gpc4?/? mutants and wildtype. (B) Venn diagrams showing unique and overlapping DEGs in dact1/2?/? and gpc4?/? mutants. (C) Gene Ontology (GO) analysis of dact1/2?/? mutant-specific DEGs in ectoderm showing enrichment for proteolytic processes. |
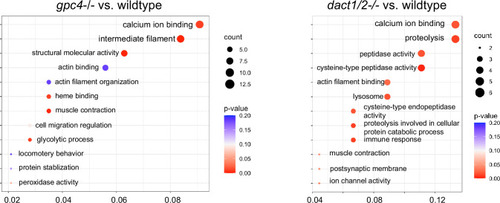
Loss of Gene Ontology (GO) analysis of differentially expressed genes (DEGs) identified between |

Expression of ( |