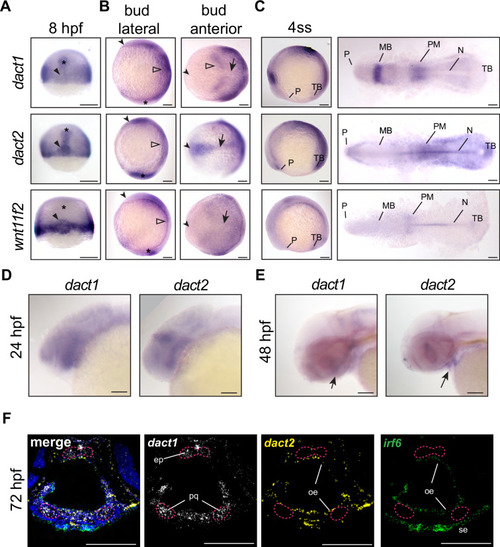
Unique and shared dact1 and dact2 gene expression domains during zebrafish development. (A–C) Representative images of wholemount in situ hybridization showing dact1, dact2, and wnt11f2 gene expression patterns. (A) At 8 hpf, dact2 and wnt11f2 are highly expressed in the dorsal margin and presumptive Nieuwkoop center of the gastrulating embryo, with dact1 being weakly detected (arrowhead). In contrast to wnt11f2, dact1, and dact2 are expressed in the presumptive dorsal mesoderm (asterisk). (B) Lateral (anterior to the left of page) and anterior (dorsal side toward top of page) views of bud-stage embryos. dact2 and wnt11f2 transcripts are both detected in the tailbud (asterisk) while dact2 is additionally expressed in the axial mesoderm (arrow). dact1 gene expression is concentrated to the paraxial mesoderm and the neuroectoderm (open arrowheads). (C) Lateral and flat-mount views of 4 ss embryos. dact2 is expressed in the anterior neural plate and polster (P), notochord (N), paraxial and presomitic mesoderm (PM) and tailbud (TB). In contrast, dact1 is expressed in the midbrain (MB) and the paraxial and presomitic mesoderm. (D, E) Representative lateral (anterior to left of page) images of wholemount in situ hybridization showing dact1 and dact2 expression patterns. (D) At 24 hpf expression is detected in the developing head. (E) At 48 hpf expression is detected in the developing craniofacial structures (arrow). (F) Representative images of RNAscope in situ hybridization analysis of dact1 (white) and dact2 (yellow) and irf6 (green) expression in transverse section of 72 hpf embryos. dact1 is expressed in the ethmoid plate (ep) and palatoquadrate (pq) orofacial cartilage, while dact2 is expressed in the oral epithelium (oe). The epithelial marker irf6 is expressed in the oe and surface epithelium (se). Dapi (blue). Scale bar: 100 μm.
|
