
IMAGE
Figure 7
- ID
- ZDB-IMAGE-241122-12
- Genes
- Publication
- Carroll et al., 2024 - Genetic requirement of dact1/2 to regulate noncanonical Wnt signaling and calpain 8 during embryonic convergent extension and craniofacial morphogenesis
- All Figures
- Figures for Carroll et al., 2024
Image
|
Figure Caption
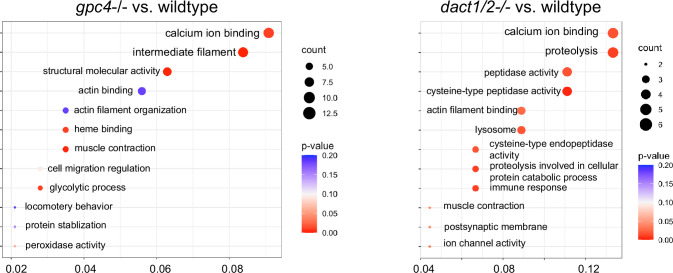
Figure 7 Pseudobulk differential expression analysis of single-cell RNAseq data. (A) Heatmaps showing the 50 most differentially expressed genes (DEGs) in 3 major cell types; ectoderm (clusters 4, 5, 6, 7), paraxial mesoderm (clusters 10, 11, 12), and lateral plate mesoderm (clusters 15, 16, 17,18) between dact1/2−/− mutants and wildtype and gpc4−/− mutants and wildtype. (B) Venn diagrams showing unique and overlapping DEGs in dact1/2−/− and gpc4−/− mutants. (C) Gene Ontology (GO) analysis of dact1/2−/− mutant-specific DEGs in ectoderm showing enrichment for proteolytic processes.
Figure Data
Acknowledgments
This image is the copyrighted work of the attributed author or publisher, and
ZFIN has permission only to display this image to its users.
Additional permissions should be obtained from the applicable author or publisher of the image.
Full text @ Elife