
- Title
-
A dataset of transcriptomic effects of camptothecin treatment on early zebrafish embryos
- Authors
- Prykhozhij, S.V., Ban, K., Brown, Z.L., Kobar, K., Wajnberg, G., Fuller, C., Chacko, S., Lacroix, J., Crapoulet, N., Midgen, C., Shlien, A., Malkin, D., Berman, J.N.
- Source
- Full text @ Data Brief
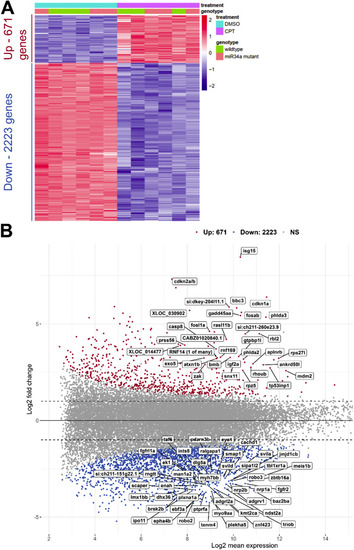
Global overview of differential gene expression after camptothecin (CPT) treatment of zebrafish embryos. |
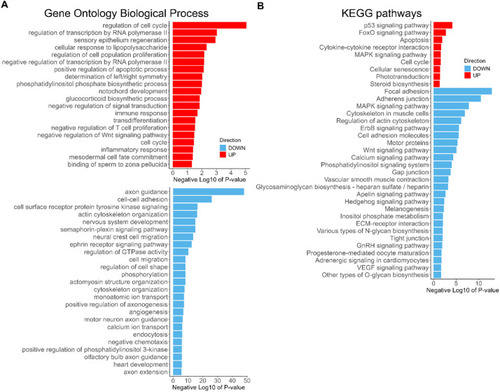
GO BP and KEGG Pathways terms enriched among the DEGs due to CPT treatment. Barplots of the Negative Log10 transformation of |
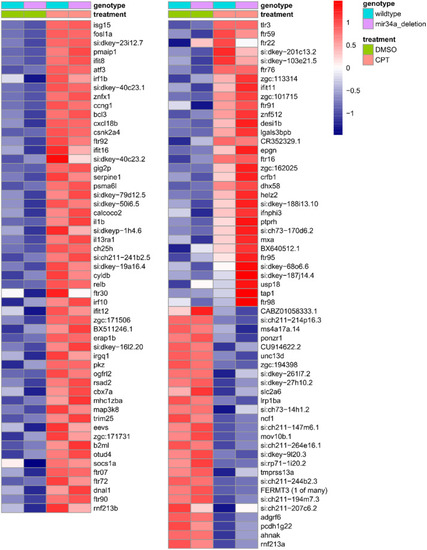
Heatmap of expression values for interferon-regulated genes (IRG) induced or repressed by DNA damage due to camptothecin treatment. Heatmap of normalized variance-stabilized gene expression values for known IRGs. To simplify presentation, averages of 3 biological replicates belonging to each treatment group are shown in the heatmap. Both up and down-regulated IRGs sorted in descending order by fold change are shown in the heatmap. The values were scaled row-wise. Treatment and genotype assignments are indicated by color bars above the heatmap, and the legend is provided at the top right. |
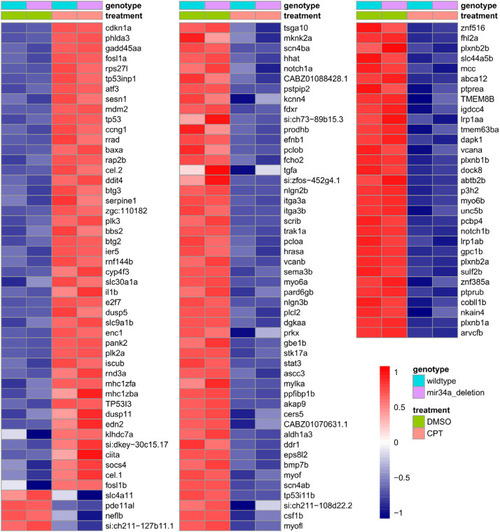
Heatmap of expression values for p53 target genes induced or repressed by DNA damage due to camptothecin treatment. Heatmap of normalized variance-stabilized gene expression values for known zebrafish orthologs of known human p53 target genes. Averages of 3 biological replicates belonging to each treatment group are shown in the heatmap. Both up and down-regulated p53 targets sorted in descending order by fold change are shown in the heatmap. The values were scaled row-wise. Treatment and genotype assignments are indicated by color bars above the heatmap, and the legend is provided on the bottom right. |