FIGURE

Fig. 2

ID
ZDB-FIG-241119-43
Publication
Prykhozhij et al., 2024 - A dataset of transcriptomic effects of camptothecin treatment on early zebrafish embryos
Other Figures
All Figure Page
Back to All Figure Page
Fig. 2

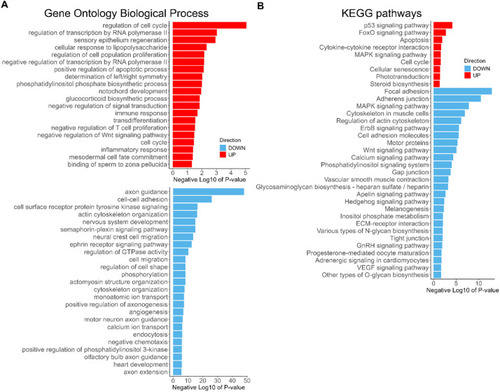
GO BP and KEGG Pathways terms enriched among the DEGs due to CPT treatment. Barplots of the Negative Log10 transformation of P-values for Gene Ontology Biological Process (A) and KEGG pathway (B) terms. (A) All of the GO BP terms associated with up-regulated genes (shown in red) are plotted as well as top 25 GO BP terms linked to down-regulated genes (light-blue). Separate plots are due to different scales of Negative Log10 of P-value. (B) KEGG pathway term plot. Direction of gene regulation is indicated by the legend on both sets of plots. (For interpretation of the references to color in this figure legend, the reader is referred to the web version of this article.)

Expression Data

Expression Detail
Antibody Labeling
Phenotype Data

Phenotype Detail
Acknowledgments
This image is the copyrighted work of the attributed author or publisher, and ZFIN has permission only to display this image to its users. Additional permissions should be obtained from the applicable author or publisher of the image. Full text @ Data Brief