FIGURE

Fig. 1

ID
ZDB-FIG-241119-42
Publication
Prykhozhij et al., 2024 - A dataset of transcriptomic effects of camptothecin treatment on early zebrafish embryos
Other Figures
All Figure Page
Back to All Figure Page
Fig. 1

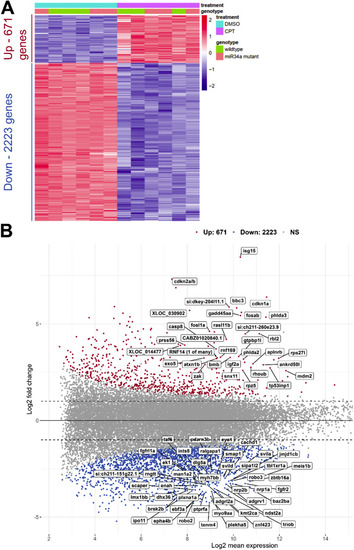
Global overview of differential gene expression after camptothecin (CPT) treatment of zebrafish embryos. (A) Heatmap plot of all DEGs after CPT treatment. Standard hierarchical clustering was performed of the variance-stabilized values which were scaled row-wise for visualization. Treatment and genotype factors are indicated in the heatmap. Numbers of up- and down-regulated genes are indicated in the side panel of the heatmap. (B) MA plot of all genes with non-DEG genes labeled in grey, up-regulated genes in red and down-regulated in blue. The names of top 80 DEGs are indicated directly on the plot. (For interpretation of the references to color in this figure legend, the reader is referred to the web version of this article.)

Expression Data

Expression Detail
Antibody Labeling
Phenotype Data

Phenotype Detail
Acknowledgments
This image is the copyrighted work of the attributed author or publisher, and ZFIN has permission only to display this image to its users. Additional permissions should be obtained from the applicable author or publisher of the image. Full text @ Data Brief